Public Channels
- # anonymous-question-box
- # ask-the-admin
- # day01-intro-genomics-biometric-model
- # day02-sem-study-design-phenomics
- # day03-quality-control-gwas
- # day04-heritability-and-gcta
- # day05-meta-analysis-prs
- # day06-genomicsem
- # day07-causal-modeling-mendelian-randomization
- # day08-sequencing-introduction-to-hail
- # day09-rare-saige
- # day10-pathway-and-gene-based-analyses
- # documentation
- # f-abcd-repronim-course-videos-instructions
- # f-creation-of-videos
- # general
- # python-intro
- # random
- # session-a
- # session-b
- # technical-support
Private Channels
Direct Messages
Group Direct Messages

@Jeff Lessem (he/him) has joined the channel


@Andrew Grotzinger has joined the channel


@Javier de la Fuente has joined the channel

@Jackson Thorp has joined the channel

@Andrea Allegrini has joined the channel

@Margherita Malanchini has joined the channel


@Test Student has joined the channel


@Sarah Brislin (she/her) has joined the channel


@Katie Bountress has joined the channel

@Peter Tanksley has joined the channel


@Charlotte Viktorsson has joined the channel


@Matthieu de Hemptinne has joined the channel


@Sam Freis (she/her) has joined the channel


@Stephanie Zellers (she/her/hers) has joined the channel


@Zoe Schmilovich has joined the channel

@Olivia Rennie has joined the channel

@Christina Sheerin has joined the channel

@William McAuliffe has joined the channel


@Francis Vergunst (he/him) has joined the channel


@Benjamin Neale hi! I put this on the faculty general channel but I'll be intermittently stuck in clinical responsibilities throughout the workshop (but of course there for all of Genomic SEM day) and currently in seminar but will be on in 40 minutes! I'll also be there for the whole afternoon session
but i'll be sure to log in as soon as i'm done and scream out my favorite beverage and name as a very cool casual way of showing up an hour late and introducing myself
or you were just saying hi and you can just ignore my explanation

*Thread Reply:* LOL. @Benjamin Neale, when you did the @Andrew Grotzinger in the meeting as an example, I knew Andrew would interpret it this way given he’d already said he couldn’t make that meeting
@Jeff Lessem (he/him) has renamed the channel from "genomicsem" to "day06-genomicsem"

Hi genomic SEM crowd! I've been wondering, if the GWAS based genetic correlation approach could be extented to compare phenotypic profiles? For instance, I run a phewas in sample A and another phewas in sample B. Assuming the set of phenotypes is the same in both samples, is there a way to compare the two phewas profiles and conclude that they have a correlation of 0.XX with a p value of 0.XXX?
*Thread Reply:* So there are interesting similarities between genetic correlation between traits and the correlation in terns of effect size between SNPs (what you propose), but there are also differences. For example 2 SNPS can be entirely uncorrelated (i.e. no LD) and have highly correlated effects on a set of traits. Though if SNPS are in high LD their effects will also be correlated.... Then what I think is really a big issue to work trough is that the correlation between SNPs, in terms of their effect on traits, is entirely dependent on the set of traits, and if we add enough trait unrelated with either SNP, we will eventually dilute the correlation. We dont really have similar issues with LDSC as we know GWAS chips cover and imperfect but fairly complete coverage of common variation.
*Thread Reply:* so I guess I am saying the elegance of LDSC is that we know we measure a substantial and quantifiable portion of the entire domain of common genetic variation something we'll never be able to replicate in the domain of phenotypes (of which there are infinite, or at least for most practical proposes infinite)
*Thread Reply:* Thanks @Michel Nivard. Follow-up question: if we have a phenotypic correlation matrix and a genetic correlation matrix, can we use GenomicSEM to formally test the null that the two correlation matrices are the same?
*Thread Reply:* genetics only for now (and likely in the future)
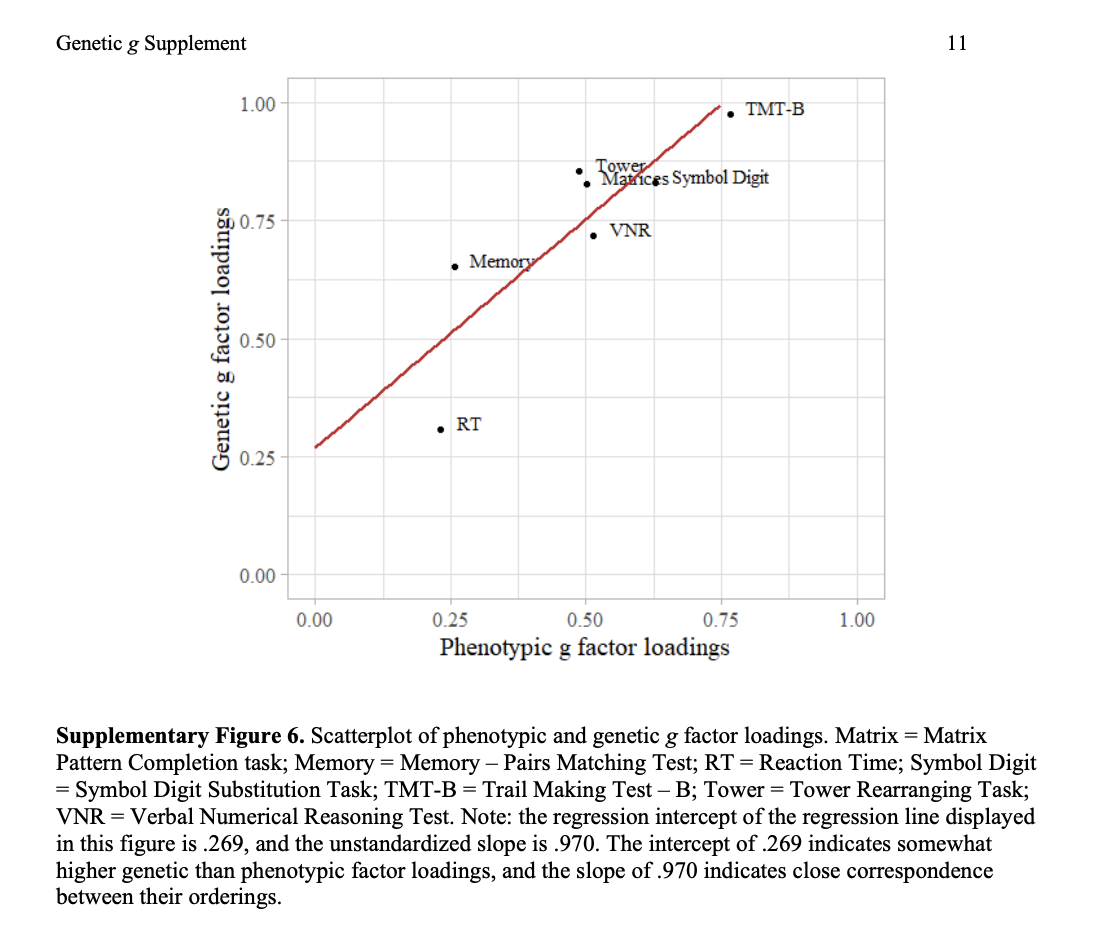
*Thread Reply:* that being said, it can be interesting to compare the factor structure in phenotype and genetic space when possible. For example, if you are examining a set of traits that are all within UK Biobank it should be relatively straight forward to fit the model for the genetic correlation matrix using Genomic SEM and to fit a model using standard approaches to the phenotypic correlation matrix. You can then do something like eyeball the differences between standardized factor loadings to get a sense of if/where the factor structure shifts. A great example of this is from the Genomic SEM g-factor paper (de la fuente et al., [2021]) where they plot the two sets of loadings against each other in the attached figure
*Thread Reply:* @Michael Neale thanks. The pheWAS analogue might have been confusing, let's forget about the SNPs.
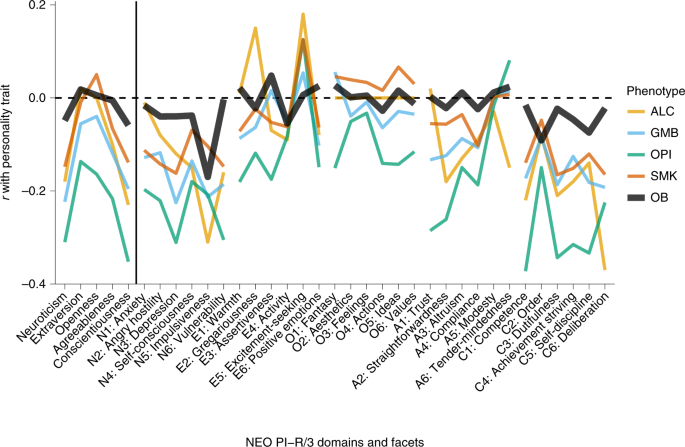
Long story short - i want to compare the personality profiles for phenotypes like it is done in LDSC. I did a crude comparison in this paper , but I'd like to incorporate the SEs somehow. Right now, the p values assume N=30 (30 personality facets) https://www.nature.com/articles/s41562-019-0752-x
*Thread Reply:* okay, resample the correlations you are correlating from the distribution: N(cor,se^2)? then you would need to account for the fact the s.e only reflect the uncertainty not the dependence bewteen uncertainties (which do arise).. do you have the raw data?
*Thread Reply:* Depends on the dataset. In that NHB paper I don't have the raw data
*Thread Reply:* sorry,what does the N() mean here=
*Thread Reply:* apologies, i'm not fully following. would you have a moment for a zoom anytime tomorrow or next week, before this seminar?
*Thread Reply:* sure, shoot me an email because this is tO far adrift of the workshop MATERIAL I think (but perhaps I misunderstand): m.g.nivard@vu.nl
*Thread Reply:* it is a bit different, but definitely inspired by the genetic correlation approach!
Video instruction on how to copy the files and get set for the practical

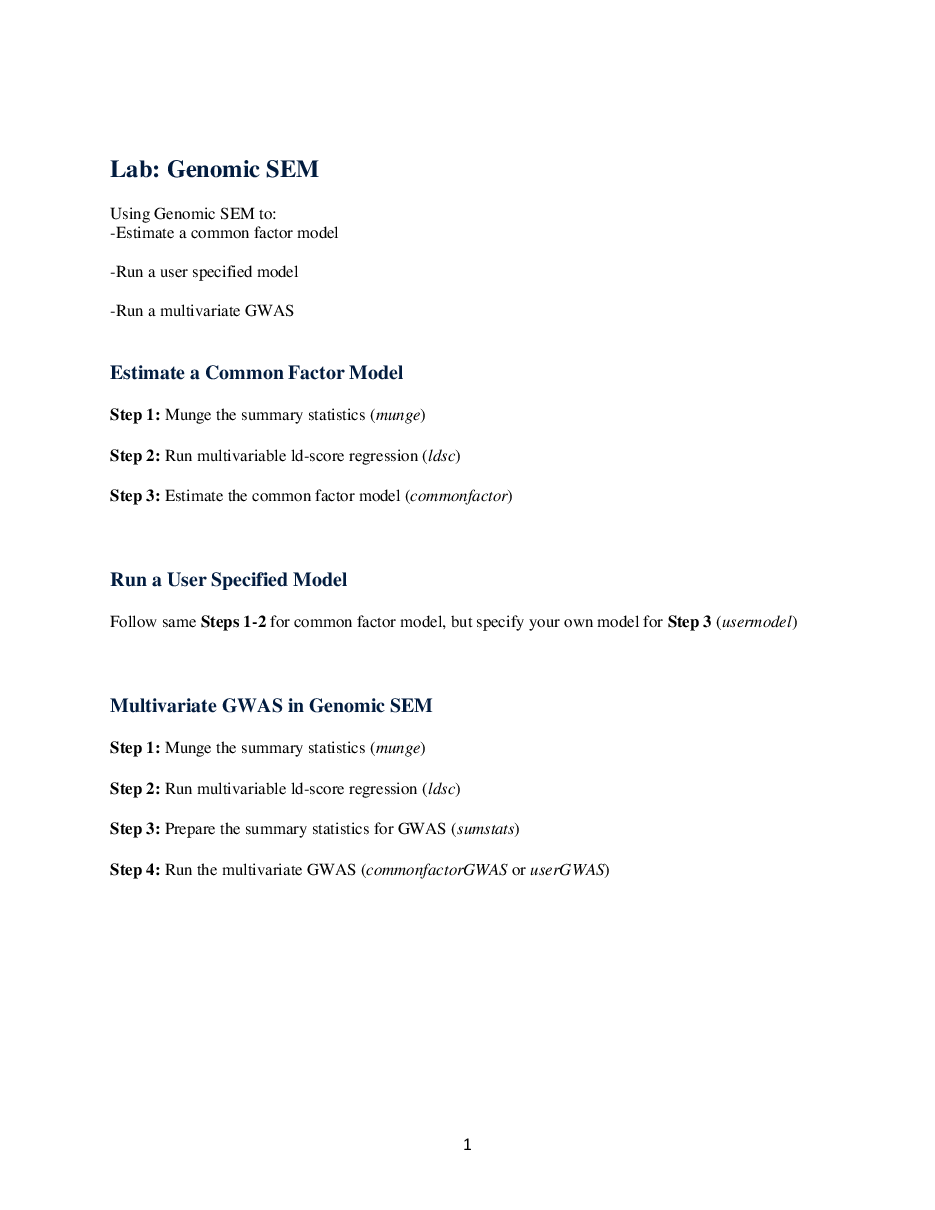
Hi everyone this is the practical worksheet in PDF format, copy the files using: "cp -r /faculty/andrew/GenomicSEM_practical/ ./" alternatively download the files from box: https://utexas.app.box.com/s/sounavy84gwygj0j2askcyaoo2ostbgu its a light set of files so shouldnt crash the system if you all copy at the same time on Monday but feel free to download earlier.

*Thread Reply:* I think it copes everyting necessary. But there is a warning/error associated with it :
cp: cannot access'/faculty/andrew/GenomicSEM_practical/.Rproj.user/233136F9/viewer-cache': Permission denied
*Thread Reply:* yeah you can safely ignore that warning!
Great stuff! Is there any repository of munged gwas summary scores so they could be more easily plugged to followup analyses? Or could genomic SEM be linked up with gwas.mrcieu.ac.uk for API-like access, for instance?
*Thread Reply:* yeah totally on our wishlist and have spoken to Gibran about it, will have to make sure we code it properly because munged susmtats are heavier then what they usually pull from that server (i..e couple of hundred SNP for MR). Though I feel in many cases it may make sense to run your own munge because you may have specific SNPs you want to keep in or study specific reference LD for example.

Hi there 🙂 Thanks for the very clear and interesting videos. I was wondering if you could elaborate on how the off-diagonal in the V matrix is computed and what it exactly represents .. I don't think I can quite grasp it yet. Thanks!
*Thread Reply:* because a lot of GWAS have sample overlap the estimates in S are interdependent. To model this we jackknive the estimates in S, which basically means we estimate S 200 times each time omitting one part of the genome in a bootstrap like procedure. this gives us a way to estimate the variance of each element in S ( which is closely related to the variance over the 200 S's) but also the covariance between the elements in S.
*Thread Reply:* Okay, thanks! Does that mean we have one off-diagonal element per possible combination of elements in S?
*Thread Reply:* YES
*Thread Reply:* caps lock I wasnt shouting

Hi, I have a question about today's videos. In which situation do you use the ML estimator and in which situation do you use DWLS and why? Thanks. 🙂
*Thread Reply:* so we (almost exclusively) use the DWLS estimator after having evaluated both in the initial genomicSEM paper (https://www.ncbi.nlm.nih.gov/pmc/articles/PMC6520146/). It should not matter too much if all your GWAS are similarly powered, but I realise thats not always the case. IFfyour GWASes do vary in sample size it might be worth it to try both and see whether your conclussions remain unchanged regardless.
*Thread Reply:* Thanks! I am still wondering: so, if your GWAS is not similarly powered you better use DWLS?
*Thread Reply:* i would personally still go with DWLS, but it's ultimately up to you in terms of what you think makes the most sense. the reason the two will differ is that ML estimation does not specifically prioritize recapturing the parts of the genetic covariance matrix that are estimated with greater precision (i.e. smaller standard errors), which will reflect those GWAS that are better powered. DWLS on the other hand prioritizes producing model estimates that match the genetic covariance estimates with the smallest standard errors. that does not mean that the model estimated in Genomic SEM using DWLS will just be dominated by the better powered GWAS of a certain trait; if that particular trait is relatively less genetically correlated with the other traits in your model then DWLS will prioritize producing smaller estimates for that trait. so it comes down to, do you think the model should use the information available and prioritize those better powered GWAS (in which case go with DWLS) or do you want it to treat each part of the genetic covariance matrix equally (in which case go with ML).
*Thread Reply:* but for us at this point we just to go with DWLS (even if the GWAS are not similarly powered) because our stance is the model should produce estimates that reflect that differential power and not ignore it
*Thread Reply:* okay, got it, thank you. ☺

@Andrew Grotzinger Did I understand correctly that the Qsnp estimates don’t reveal details about the specific effects of the SNPs on the indicators, and that they are just testing the common factor vs independent pathways models against each other? If so, would it make sense to specify the independent pathways model (where there are significant Qsnp estimates) to get the path specific estimates? (sorry if you covered something like that and I missed it)
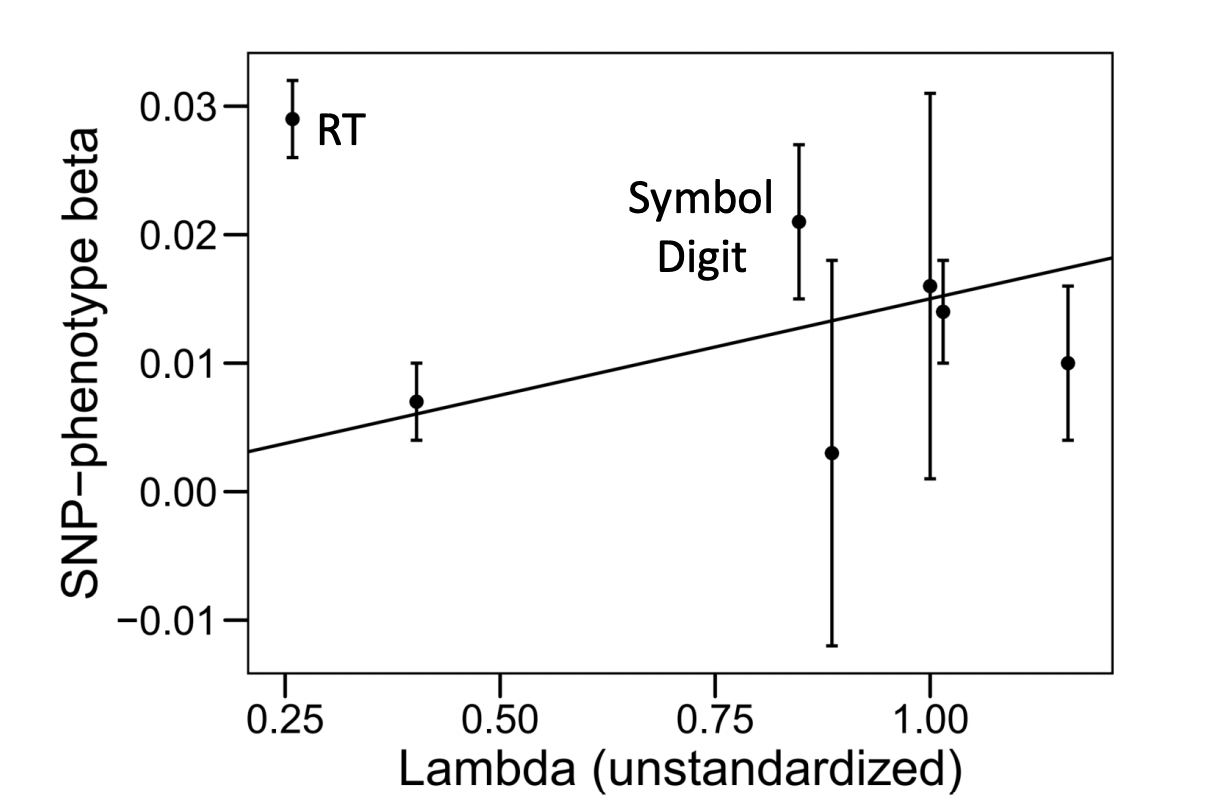
*Thread Reply:* it's a great question! since QSNP captures deviations from the factor model, it can be informative to do something like plot the unstandardized factor loadings from the common factor model that does not include the individual SNPs against the SNP-phenotype betas from the GWAS sumstats for the particular SNP that was significant for Q (i.e., not going through the work of pulling the independent pathways estimates from a Genomic SEM model, though they should be similar). within the scatterplot, if you then draw a line of best fit through the estimates a QSNP significant SNP will typically show one or two univariate GWAS estimates that strongly deviate from the line indicating that this trait is driving the QSNP effect. For example, in the attached scatter plot from the g-factor paper from de la Fuente et al. (2020) they see that reaction time (RT) strongly deviates from the line; this reflects a SNP that has a particularly strong association with RT, but RT does not load strongly on the g-factor, so it does not fit the model and is identified as significant for QSNP. if you have a lot of QSNP effects, what I have done is create a table that lists the univariate GWAS betas and Z-statistics for those SNPs, in which case there tends to be some effects that stand out as the outlier in the bunch that are clearly driving the QSNP effect. I've then created a scatterplot for just the top 4 or 5 most significant QSNP effects.
Is there a good trade-off between reducing the SNP set and computation time while getting sensible results? When playing around with real data, I imagine that trying stuff out will take a lot of time due to processing time. Ideally, I would use a reduced datset to get my syntax right and then run the model with full data, once I am happy with it.
for munge, ldsc, and the usermodel and commonfactor functions i would use the full set of SNPs even when in the troubleshooting phase. collectively these will typically only take 20-30 minutes for 5-10 traits. when troubleshooting multivariate GWAS (the userGWAS or commonfactorGWAS) functions I would run sumstats using the full set of SNPs, and then subset out maybe 1,000 SNPs to run before setting up a full run
@channel paste your model(s) and fit during the practical as a reply to this!

*Thread Reply:* F1=~NASCZ+BIP+MDD+INSOM
F2=~NAEA+MDD+INSOM
F1~~1F1
F2~~1F2
AIC       CFI       SRMR
75.30192 0.9481178 0.05215512
*Thread Reply:* Interestign now try and beat your own model!
*Thread Reply:* #Group3
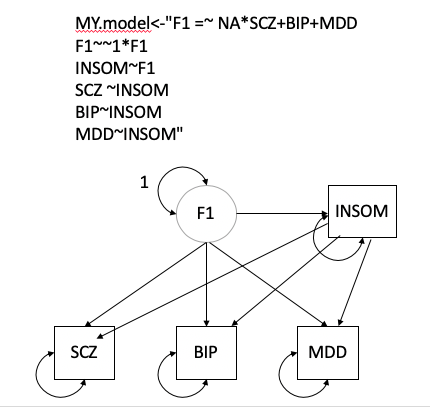
MY.model<-"F1=~NASCZ+BIP+MDD
F1~~1F1
INSOM~F1
EA~INSOM
EA~SCZ
EA~MDD
EA~BIP
"
YourModel$modelfit
       chisq df       p_chisq       AIC        CFI      SRMR
df 113.47442  2 2.2873985e-25 139.47442 0.87773131 0.1127415

*Thread Reply:* F1=~NA**MDD+BIP
F2=~NA**BIP+SCZ
F1~~1**F1
F2~~1**F2
INSOM~F1
EA~F2
YourModel$modelfit
     chisq df      p_chisq      AIC       CFI       SRMR
df 98.9405  2 3.275996e-22 124.9405 0.8936726 0.07281335
Group2: mdd.model<-"F1=~NASCZ+BIP+MDD F1~~1F1
INSOM~F1
INSOM~MDD EA~INSOM"
chisq df      p_chisq      AIC      CFI       SRMR
df 111.3445  5 2.129702e-22 131.3445 0.883358 0.08609289
*Thread Reply:* Thats a great start, how about a second model thats only regressions and no latent variables?
*Thread Reply:* ok. can we see modification indices to explore further?
*Thread Reply:* mdd.path.model<-" INSOM~MDD EA~INSOM"
*Thread Reply:* chisq df p_chisq AIC CFI SRMR
df 2.427048 1 0.1192573 12.42705 0.9962303 0.01897433

*Thread Reply:* MY.model2 <-”
INSOM~MDD
EA~INSOM+BIP+SCZ”
chisq df       p_chisq      AIC        CFI        SRMR
df 26.54096  3 7.3472907e-06 50.54096 0.97417953 0.049227234
*Thread Reply:* mediation model! no model fit, though
model <- ' # direct effect EA ~ cMDD # mediator INSOM ~ aMDD EA ~ bINSOM # indirect effect (ab) ab := ab # total effect total := c + (ab)
         perc:=ab/total
     '

Group 9: MY.model<-"F1 =~ NASCZ + BIP + MDD F2 =~ NAMDD + INSOM F1 ~~ 1F1 F2 ~~ 1F2 EA ~ F1 + F2"
chisq df     p_chisq      AIC       CFI       SRMR
df 49.30197  2 1.96885e-11 75.30197 0.9481177 0.05215518

"F1=~NASCZ+BIP+MDD F1~~1F1 INSOM~F1 EA~INSOM BIP~~MDD SCZ~~BIP"
chisq df p_chisq AIC CFI SRMR df 59.93606 3 6.066072e-13 83.93606 0.9375507 0.06284154

Group 14 ```> MY.model<-"F1=~NA**INSOM+BIP+MDD
- F1~~1**F1
- SCZ~F1
- EA~SCZ" YourModel$modelfit chisq df p_chisq AIC CFI SRMR df 505.2232 5 5.9537e-107 525.2232 0.4513393 0.1615591```

```> MY.model<-"F1=~NA**SCZ+BIP+EA
- F2=~NA**MDD+INSOM+EA
- F1~~1**F1
- F2~~1**F2" > YourModel$modelfit chisq df p_chisq AIC CFI SRMR df 111.4907 3 5.242001e-24 135.4907 0.8810039 0.09761694```
MY.model<-"F1=~NA**SCZ+BIP
F1~~1**F1
F2=~NA**MDD+INSOM
F2~~1**F2
EA~F1+MDD+INSOM"
       chisq df       p_chisq       AIC        CFI        SRMR
df 49.301941  2 1.9688815e-11 75.301941 0.94811773 0.052155135

Group 6
MY.model2 <- "F1=~NA**SCZ+BIP+MDD
F1~~1**F1
EA~F1
INSOM~EA
INSOM~MDD"
> YourModel$modelfit
       chisq df       p_chisq       AIC       CFI        SRMR
df 132.85012  4 9.5671851e-28 154.85012 0.8586731 0.084212699

OUR.model3 <- "F1=~NASCZ+BIP F2=~NAMDD+INSOM F1~~1F1 F2~~1F2 EA~F1+F2 F1~~F2"
Group 4: ```MY.model2<-"F1=~NA**SCZ+BIP+MDD
- F1~~1**F1
- SCZ ~~ BIP
- BIP ~~ MDD
- INSOM~F1
- EA~INSOM" > YourModel$modelfit chisq df p_chisq AIC CFI SRMR df 59.93606 3 6.066056e-13 83.93606 0.9375507 0.06284153```
chisq df      p_chisq       AIC        CFI        SRMR
df 111.49075  3 5.241987e-24 135.49075 0.88100391 0.097616936

Group 7: ```MY.model<-"F1=~NASCZ+BIP+MDD F2=~NAMDD+INSOM+EA F1~~F2 F1~~1F1 F2~~1F2 "
chisq df p_chisq AIC CFI SRMR
df 61.76184 3 2.47033e-13 85.76184 0.9355481 0.06025005```
Room 14: ```> table(pfactor_GWAS$warning)
                                                   0
                                                  88
lavaan WARNING: some estimated ov variances are negative 4 ``` is this correct? what are these warnings related to?
*Thread Reply:* hi Laura, that is correct. It means that the model is estimating the residual variance (the variance left after accounting for the variance explained by the common factor) of one of the variables as negative. This is what the userGWAS code in the next section is designed to troubleshoot by putting model constraints on each of the residuals to be above .001
*Thread Reply:* Thank you @Andrew Grotzinger.. so does it mean that the ‘4’ in the output is referring to 4 individual SNPs contributing to the negative residual variance for one of the variables? (or have I got that completely wrong?!)
*Thread Reply:* the GWAS functions are running as many separate models as their are SNPS, so that means that 4 SNPs from 4 different models produced the same warning (may be what you were already saying)
Perhaps a dumb question but could you please clarify the conceptual difference between a PRS and the partitioned heritability via LDSC that goes into genomic SEM? Essentially what is the difference between genetic liability and genetic risk?
*Thread Reply:* not dumb at all! just a point of clarification first, but partitioned heritability refers to when you split up the heritability across classes genes (e.g., genes expressed in the brain) whereas LDSC from the practical today is estimating the heritability explained by the SNPs. PRS and heritability are related to the extent that PRS are going to be better powered for traits with higher heritability estimates. They diverge in that heritability is a population level estimate, while PRS is designed to predict individual risk, and as such the PRS is going to be really bad at predicting risk for certain individuals. Take as an example a individual genetic variant that is super rare in the population such that it does not have a large effect on heritability at a population level, but for those individuals that carry the risk conferring variant it has a huge effect on the outcome. In this case the PRS is going to miss that piece of the puzzle entirely. The two papers below do a nice job of talking about some of these considerations: Harden, K. P., & Koellinger, P. D. (2020). Using genetics for social science. Nature human behaviour, 4(6), 567-576.
*Thread Reply:* Torkamani, A., Wineinger, N. E., & Topol, E. J. (2018). The personal and clinical utility of polygenic risk scores. Nature Reviews Genetics, 19(9), 581-590.
*Thread Reply:* Hi there @Andrew Grotzinger! Thanks so much for taking the time to provide such a helpful response. Yes, I think I was hearing Michel talk about partitioned heritability when I was writing out my question - my mistake!
I just wanted to know what's best practice when you have GWAS sumstats of relatively small sample sizes (10-30k), with significant heritability, but rather large SE, as the model fit indices don’t give SE’s or 95% CIs. Are there any aspects of the model that you can use to determine whether the model is reliable, besides the model fit indices?
*Thread Reply:* we could think about implementing bootstapped confidence intervals on the fit statistics, before any type of fit comes into play though, if you have a small sample some of the first considerations are: 1.What does the model teach you about the relation between traits that you cannot learn without the model and 2. are you convinced of all the causal assumptions and directions implied in your model? if you cant articulate an awnser to 1 and your awnser to 2 is "no" then should you proceed? there is the quote from George Box that goes: "All models are wrong, some models are usefull".
*Thread Reply:* you can also try doing what Michel suggested during the practical today and splitting by odd and even chromosomes and re-running the model. if the power of the GWAS is low enough that the model completely shifts in terms of the theoretical conclusions drawn then you might be more tentative about your results. of course, this assumes that LDSC still produces estimates within the realm of possibility when you split a small sample size GWAS across odd/even (e.g., no negative heritability estimates)
*Thread Reply:* Many thanks for the answers, makes a lot of sense and we'll give the splitting across odd /even a try. One thing we also wondered is how to compare between different exploratory models and further determine what factor loadings to include then in my confirmatory model ?
*Thread Reply:* in most cases when you run an exploratory model you will use some sort of cut-off to determine the number of factors to retain and an additional cut-off based on the loadings to determine what items to include on which factors. These decision points can frankly be somewhat arbitrary, but I'll offer a few options that I've seen. As far as how many factors to retain, one approach is to stop including additional factors at the point at which the additional factors are only explaining so much additional variance across the items. There are lots of formal tests out there for (Kaiser rule, optimal coordinates, acceleration factor, scree test) that use some version of this principle to land on the number of factors, or you might say that at the point where my factors are explaining, just as an example, < 20% of the variance across items then I'll stop adding additional factors. As far as factor loading cut-offs, I've seen standardized loading cut-offs as low as .2 and as high as .7, but have personally used around .35 in the work I've done.
*Thread Reply:* Thanks so much for the great suggestions, will give this a go!
just putting at the front of the messages here for the Session B crew that the files for the Genomic SEM tutorial can be copied using: "cp -r /faculty/andrew/GenomicSEM_practical/ ./" the files can also be download from box: https://utexas.app.box.com/s/sounavy84gwygj0j2askcyaoo2ostbgu. the pdf for the tutorial is also attached. see everyone in a few hours!

*Thread Reply:* great! also post your model fit if it converged
*Thread Reply:* We updated the model as it did not converged
*Thread Reply:* YourModel2$modelfit
chisq df p_chisq AIC CFI SRMR
df 0.4441685 1 0.50511733 18.444168 1 0.0093329907
Group 10 ```MY.model<-"F1=~NASCZ+BIP+MDD F2=~NA_2SCZ+BIP+MDD F2~~1F2 F1~~1F1 INSOM~F2 EA~F1"
> YourModel$modelfit chisq df p_chisq AIC CFI SRMR df 17.21888 1 3.331094e-05 45.21888 0.9822106 0.03500922```

MY.model2<-"F1=~NA**SCZ + a**SCZ + a**BIP
F2 =~ NA**BIP + MDD + INSOM
EA ~ F1 + F2
F1~~1**F1
F2~~1**F2
F1~~F2"
*Thread Reply:* > YourModel2$modelfit
chisq df p_chisq AIC CFI SRMR
df 108.97976 3 1.8192433e-23 132.97976 0.88375804 0.095027369
Group 11:
MY.model <-"F1=~NA**BIP+SCZ+INSOM
F1~~1**F1
EA~F1
INSOM~MDD
"
Model fit:
chisq df       p_chisq       AIC        CFI       SRMR
df 404.69035  5 2.8928548e-85 424.69035 0.56160695 0.15616543
also share your model fit if you got the model to run

Group9
MY.model<-"F1=~NA**SCZ+BIP+MDD+INSOM
F1~~1**F1
EA~F1
SCZ~~BIP"
chisq df     p_chisq      AIC       CFI      SRMR
df 155.6856  4 1.23045e-32 177.6856 0.8336264 0.1289839

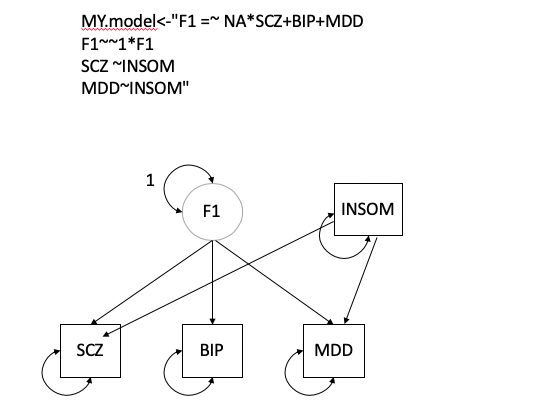
M3.model <- "SCZ~INSOM
BIP~INSOM
MDD~INSOM
INSOM~EA
SCZ~~BIP
SCZ~~MDD
MDD~~BIP
"
> YourModel3$modelfit
       chisq df       p_chisq       AIC        CFI        SRMR
df 59.936037  3 6.0661301e-13 83.936037 0.93755075 0.062841542

mod1 <- "F1=~ NASCZ+BIP F1~~1F1 F1~~MDD INSOM ~ MDD + F1 EA ~ INSOM"
Group 8
MY.model2<-
"F1=~NASCZ+BIP+EA
F2=~NABIP+MDD+INSOM
F1~~1F1
F2~~1F2
F1~~0**F2"
> YourModel2$modelfit
       chisq df       p_chisq       AIC        CFI       SRMR
df 425.08459  4 1.0556926e-90 447.08459 0.53814106 0.13811987

our_model5 <- 'F1 =~ SCZ + BIP + EA F2 =~ MDD + INSOM + EA F1 ~~ 0**F2 '
The model fit is:
Model1$modelfit
      chisq df       p_chisq      AIC        CFI        SRMR
df 66.58176  4 1.1943541e-13 88.58176 0.93135834 0.061508945

I was wanting to work out how to create the anthro.model from your tutorial PPT (slide 57 with the Overweight and Early Life factors). Could you please let me know what I have coded incorrectly as the following model won't converge. covstruc<-anthro anthro.model<-"Overweight=~NABMI+WHR+CO+Waist+Hip EarlyLife=~NAHip+Height+IHC+BL+BW Overweight~~1Overweight EarlyLife~~1EarlyLife Overweight~~EarlyLife BL~~1BL BW~~1BW IHC~~1IHC Height~~1Height Hip~~1Hip Waist~~1Waist CO~~1CO WHR~~1WHR"
*Thread Reply:* you'll want to take out the pieces where you fix the residual variances of the indicators to 1. I can see why you have added that in based on the path diagram; path diagrams are typically depicted this way with a latent factor for the residual variance because this is not something that is actually observed in the data, and so it's common to show it as a latent with a factor loading fixed to 1 and the variance of that latent shown that depicts the residaul. so to run that model you would write: "Overweight=~NABMI+WHR+CO+Waist+Hip EarlyLife=~NAHip+Height+IHC+BL+BW Overweight~~1Overweight EarlyLife~~1EarlyLife Overweight~~EarlyLife"
*Thread Reply:* Thanks so much Andrew! This corrected model aligns to the path diagram. Could you also please let me know the consequence of this warning/note from running the model? ""The S matrix was smoothed prior to model estimation due to a non-positive definite matrix. The largest absolute difference in a cell between the smoothed and non-smoothed matrix was 0.000128450830733567 As a result of the smoothing, the largest Z-statistic change for the genetic covariances was 0.0157580978138476 . We recommend setting the smooth_check argument to true if you are going to run a multivariate GWAS.""
*Thread Reply:* I apologise if this has been covered in the online videos
*Thread Reply:* no it wasn't covered so I'm glad you asked! That warning reflects the fact that the genetic covariance (S) matrix is non-positive definite for this set of traits, so it was smoothed to positive definite prior to running the model. In this case, the largest difference in the genetic covariance matrix pre and post-smoothing is very small (.0001) so it's not something to be overly concerned about. We write on the github towards the bottom of one of the wiki pages (https://github.com/GenomicSEM/GenomicSEM/wiki/3.-Models-without-Individual-SNP-effects) that if the difference is > .025 this would be an interpretive concern and since smoothing at that level is going to oftentimes be caused by less well-powered GWAS being included in the model you might consider excluding those to see how estimates change.

Hi, thanks a lot for all the time you put into answering my question yesterday.
I still have some questions. I was thinking about model identification. I am still not 100 % clear about what we can infer from a saturated model (if I understand correctly, the GWAS by subtraction in @Perline Demange et al. is an example of a saturated model. 3x3 varcovar matrix, 6 observed 6 estimated).
Is it the case that in a saturated model, being a perfect match of the data (?), all the fit indices become meaningless? And if so, is the interpretability of the results only conditional to the assumption that the model’s specification is (very) good?
In sum, I would like to understand how to evaluate results obtained from a saturated model (e.g., should I look at the path estimates and their se?).
Thanks!
*Thread Reply:* you can't distinguish between saturated models, or test their fit based on the data you have in hand. In the cogNonCog paper we do a lot of sensitivity analyses where we test whether specific violations of the model (reverse causation or cog and noncog being correlated) would influence our findings.
*Thread Reply:* I was writing a long reply but I got it 🎉(for the cog non cog example), thanks. Last question (I hope): in genomic SEM, if you were about testing the effect of only one SNP, would you base the interpretation of your results on the significance of the path estimate ?
*Thread Reply:* If you are running a model in which the SNP is predicting a factor, I would interpret the results based on two findings: the significance of the effect of the SNP on the factor and the significance of QSNP. If you have a significant SNP effect and not a significant QSNP that reflects a SNP that is likely to operate through the general pathways of the latent factor. If you have something that is significant for both Q and the latent factor that reflects a SNP that does not conform to the factor loadings, and oftentimes is observed when a SNP has a much larger effect on one of the traits or the SNP has directionally opposing effects on the traits. The commonfactorGWAS function automatically produces Q, and if the model is being run in the context of userGWAS you would compute Q via the chi-square difference across two models: a model in which the SNP predicts only the latent factor (i.e., common pathways model) against a model in which the SNP directly predicts the individual traits that define the factor (i.e., independent pathways model)
*Thread Reply:* @Andrew Grotzinger I’m trying to get my head about thinking about these models where SNPs are predicting a common factor - and trying to understand how this works given that the SNPs are also indirect indicators the common factor.. (at least I think they are?!)
*Thread Reply:* is your question relating to the fact that ld-score regression uses the SNPs to produce the genome-wide genetic covariance estimates, and then we specify an individual SNP to predict a factor that is defined by the ld-score regression genetic covariance results (i.e., are we somehow "double dipping" from the SNP effects in some way?)
*Thread Reply:* yes! I wasn’t sure how to articulate it but that perfectly sums up my question
*Thread Reply:* great question! so i think there's two pieces to answering this,. The first is what the SNP-level analyses are offering aside from just modeling the factor. The SNP-level estimates are useful because in many cases the SNPs may not fit the factor model. For example, it could be that the genetic covariance between trait 1 and trait 2 operate through very different biological pathways then the covariance between trait 2 and trait 3. In this case, even though you can model a common factor, the SNPs are generally not going to operate through the factor, which is something you can assess using the QSNP statistic. This is a fairly unique advantage to Genomic SEM, namely the ability to stress test the factors and see whether they have utility for understanding shared biological processes at different levels of analysis (e.g., the SNP-level). The second piece to this is whether or not double dipping on the SNP effects would bias estimates in some way, which is to say is it statistically appropriate? The short answer is that because the ld-score regression results are produced for approximately 1.1 million SNPs, and you are only including one SNP in the model, the dependency between these estimates is effectively 0. We talk more about this in the method section of the original Genomic SEM paper: Grotzinger, A. D., Rhemtulla, M., de Vlaming, R., Ritchie, S. J., Mallard, T. T., Hill, W. D., ... & Tucker-Drob, E. M. (2019). Genomic structural equation modelling provides insights into the multivariate genetic architecture of complex traits. _Nature human behaviour, 3(5), 513-525.
*Thread Reply:* what a great answer, thank you so much.

Does using summary statistics from more recent LMM methods such as ReGenie, FastGWA and FastGWA-GLMM cause any issues in Genomic SEM?
*Thread Reply:* These can be used in GenomicSEM but the thing to check for is inflated LDSC intercepts for these sumstats (check values of diag(covstruc$I) that are well above 1). It's mostly an issue with highly heritable traits from large cohorts.
*Thread Reply:* yes/no/maybee? So we have been warning ppl that the LDSC model for heritability (but less for genetic correlation) breaks down slightly when you use LMM, though in practice we havent noticed very pronounced differences other then for highly heritable traits in large cohorts
*Thread Reply:* haha ok well at least we seem to be on the same page among ourselves 🙂
*Thread Reply:* great thank you 🙂 I'm guessing the same applies to SAIGE?
*Thread Reply:* i've looked at SAIGE using the european subsample from the panUKB analyses, FastGWA, and Hail results in UKB for BMI and found h2 estimates that were all within 1-2% of each other so it seems fine enough. I will flag that the intercept problem brought up above was the most pronounced for SAIGE, and we had someone recently reach out using SAIGE estimates who didn't set the intercept to 1 and were finding severely deflated signal for multivariate GWAS results.

Hello, I have a couple of questions about some GenomicSEM models I am estimating. The first is about allowing residuals to correlate across factors in a userGWAS model. I am specifying a correlated two-factor model with 3 indicator GWAS for each factor. I have reason to believe that it may be appropriate to account for residual correlation between some indicators on separate factors. This model has good fit without SNPs (X2 = 6.47, df = 5, P = 0.26, AIC = 38.47, CFI = 0.985, SRMR = 0.088), but when I fit this model to SNP-level data I get the following warning for about half of my SNPs: “Covariance matrix of the residuals of the observed variables (theta) is not positive definite.” Any ideas about what may cause this discrepancy between the model without SNPs and that with SNPs?
The second is about a GWAS-by-subtraction model. When I fit a GWAS-by-subtraction model for two of my traits, one of my resulting sets of summary statistics has almost no variants with p-values less than 0.05 similar to this post on the GenomicSEM Google group : https://groups.google.com/g/genomic-sem-users/c/PAubVTiI6Is. Any Ideas about why this might occur?
I will post my questions to the GenomicSEM Google group as well in case these questions are more appropriate for that platform. Thank you!
*Thread Reply:* Hi Alex! I would suggest saving the full model output for a handful of SNPs that are producing that warning and comparing to the model output for the model without individual SNP effects. If it doesn't look like it's producing estimates that are any different than the model without individual SNPs, then that is some indication that this may be a relatively benign warning since the model without SNPs is not producing that warning about the non-positive definite theta matrix. The most common culprit for a theta (i.e., residual) matrix type warning or error is a negative residual variance, which you can check when looking at the runs for the individual SNPs. This can also occur in the specific context of estimating residual covariances. This reflects a somewhat less common situation where you are estimating residual covariances between some variables that have very little residual variance to begin with after accounting for the variance explained by the factors. My sense is the userGWAS model is then throwing this error when the variance explained by the SNP via the factor just pushes that theta matrix to be non-positive definite. In the absence of negative residuals, a misspecified model, or really bizzare model estimates I would consider this a safe warning to ignore (particularly because you do not see the warning in the model without SNPs.
For your question about the p-values > .05 for the GWAS-by-subtraction model, someone else ran into that same issue (https://github.com/GenomicSEM/GenomicSEM/issues/38) and found that the culprit was misspecified arguments for the sumstats function. You might check that the p-values from your sumstats output are not also attenuated first, which would be some indication that the arguments are off there.
*Thread Reply:* Thanks so much Andrew! I had similar thoughts about the first issue, so that’s encouraging! I’ll definitely look into the sumstats I used for the GWAS-by-subtraction to make sure I haven’t misspecified something. Thanks again!