Public Channels
- # anonymous-question-box
- # ask-the-admin
- # day01-intro-genomics-biometric-model
- # day02-sem-study-design-phenomics
- # day03-quality-control-gwas
- # day04-heritability-and-gcta
- # day05-meta-analysis-prs
- # day06-genomicsem
- # day07-causal-modeling-mendelian-randomization
- # day08-sequencing-introduction-to-hail
- # day09-rare-saige
- # day10-pathway-and-gene-based-analyses
- # documentation
- # f-abcd-repronim-course-videos-instructions
- # f-creation-of-videos
- # general
- # python-intro
- # random
- # session-a
- # session-b
- # technical-support
Private Channels
Direct Messages
Group Direct Messages

@Jeff Lessem (he/him) has joined the channel

@Sarah Medland (she/her) has joined the channel

@Adrian Campos has joined the channel

@Katrina Grasby has joined the channel

@Andrea Allegrini has joined the channel

@Jackson Thorp has joined the channel

@Lucía Colodro-Conde has joined the channel


@Jodie Painter has joined the channel

@Test Student has joined the channel


@Sarah Brislin (she/her) has joined the channel


@Katie Bountress has joined the channel

@Peter Tanksley has joined the channel


@Charlotte Viktorsson has joined the channel


@Matthieu de Hemptinne has joined the channel


@Sam Freis (she/her) has joined the channel


@Stephanie Zellers (she/her/hers) has joined the channel


@Zoe Schmilovich has joined the channel

@Olivia Rennie has joined the channel

@Christina Sheerin has joined the channel

@William McAuliffe has joined the channel


@Francis Vergunst (he/him) has joined the channel


@Jeff Lessem (he/him) has renamed the channel from "meta-analysis-prs" to "day05-meta-analysis-prs"
In this session we will be using terminal.
To get started ssh into the workshop server. Use mkdir to make a working directory for today's tutorial and copy the files from /faculty/sarah/2021/MAPRS/ to your working directory. cp /faculty/sarah/2021/MAPRS/** ./
At the start of the session I will share the online worksheet for the tutorial - both in this channel and in the zoom chat window.
The practical will involve some R analyses, the tutorial assumes you will run these using the terminal window but you can use R studio is you prefer to. The R code will make some plots that you will need to download to open. You can use an SCP program to do this OR have a second terminal window and use sftp. Some SCP programs that you could use are https://winscp.net/eng/index.php OR https://filezilla-project.org/
Hello, question I would greatly appreciate input on - related to a combination of QC and PRS. I’m brand new to PRS analyses. I have polygenic risk scores calculated for a set of data, but would like to account for population stratification using principal components, using 1000 Genomes data for constructing the PCs. I’m struggling with the code for this. Any help/resources would be fantastic!
*Thread Reply:* Hi Olivia - I think Loic is talking about how to calculate PCs on day 4. If not we'll pick this question up after that session.
*Thread Reply:* Comparing to a reference panel like 1000 genomes is useful if you are uncertain about the ancestries of participants in your sample and need to divide them into ancestries groups. When using PRS you want your final PCs to be calculated just within your sample. The reason is when PCs are calculated in the 1KG panel, the first few PCs separate out the continental ancestry groups and thus don't capture population stratification within your sample, who should all be of similar ancestries.
*Thread Reply:* Thanks to both of you for your responses! I appreciate you continuing this question here if not covered in Loic's material today.

*Thread Reply:* The MDS (multidimensional scaling) you calculated in the QC session is equivalent to PCA so you have code to do so!
*Thread Reply:* Ok fantastic, thank you!

*Thread Reply:* I want to add a caveat to what @Mark Adams said. I think it’s often best practice to include both PCs projected from 1kG AND PCs from within your own sample. ONLY controlling for PCs in your own sample can lead to unfortunate consequences in some instances. For example, in the GIANT meta-analysis, each cohort controlled for within-sample PCs, but this meant there was minor uncorrected-for stratification due to between-cohort differences in ancestry. This led to false signals in findings regarding selection & height. Had each cohort also corrected for a common set of PCs projected from 1kG (or better yet, a pan-EUR ref panel), this wouldn’t have occurred. So I agree with what Mark said, but with the caveat of: be careful that you really have controlled for all the dimensions in your own data. When doing a meta-analysis, your “own data” includes all the between-cohort information as well.
*Thread Reply:* Ah, makes sense, I appreciate you adding this.

Hi all! I plan on getting into our Zoom room 30 minutes before the session starts (A&B) if think you need help and you want to get a head start on copying any files or ensuring that you've got a good start to your practical. If you think need additional help in advance, just send me a note. See you soon!
Hi Everyone in the day5 prac you will be making some plots using R and you will need to be able to open them and look at the plots - if you need help learning how to open files sitting on the workshop server please join the zoom room early - thanks!
In this session we will be using terminal.
To get started ssh into the workshop server. Use mkdir to make a working directory for today's tutorial and copy the files from /faculty/sarah/2021/MAPRS/ to your working directory. cp -r /faculty/sarah/2021/MAPRS/ .
At the start of the session I will share the online worksheet for the tutorial - both in this channel and in the zoom chat window.

Hi, I have a question on the Polygenic Risk Scores video @Adrian Campos, In the video you're talking that polygenic risk scores can be used to test for genetic overlap between traits. Can you explain a litlle bit more on this topic? or just add reference papers? thanks!
*Thread Reply:* An example of this would be using a GWAS of Depression to predict Bipolar disorder. The results don't give you an estimate of genetic correlation but can provide an indication of genetic overlap.
Here is a short video to show how to copy the files for day 5 (thanks Michel Nivard for the suggestion)

In relation to the Polygenic Score video - what are examples of potential bias's in the discovery GWAS and target sample? Also, I wanted to know people's thoughts on the optimal methods for selecting the correct p-threshold PGS to include in a multiple PGS analysis so as not to over-account for multiple testing? What do you think of methods such as permutation of the phenotypic measure to select the optimal p-threshold for each PGS?
*Thread Reply:* Hi can you explain the first part of your question more? I'm not sure what you mean re baises.
*Thread Reply:* this was on the last slide "Be wary of jumping too fast to conclusions consider potential biases in the discovery GWAS and the target sample"
*Thread Reply:* Re the second part - the answer depends on what question you are trying to answer with your data. If your aim is to use the PRS to understand genetic architecture then I would use a series of 8 thresholds with increasing liberalness. Remember these PRS are not independent of each other so the testing correction here is not /8. If you aim is prediction I would consider using one of the other PRS methods such as LDpred or SBayesR
*Thread Reply:* How about when you are using them for prediction and are using pre-calculated PGSs and have multiple p-thresholds to choose from.
*Thread Reply:* Thanks for the clarification - One example I know of is a PRS analysis where the outcome variable was Depression and the PRS was for education. The result went in the opposite direction than expected in the literature. The analyst investigated and found that the cases and controls in that sample differed in education status and the cases had significantly more years of education than the controls which led to this unexpected result.
*Thread Reply:* If I was trying to run a prediction analysis I would not use precomputed PRS. If that was the only choice I would decide and post my decision in a pre-registered study design so that it was clear the decision was made before looking at results. Often a threshold of .001 or .05 works well. But it depends on the trait, the discovery GWAS and the target sample so there is no way of knowing up front.
*Thread Reply:* @Sarah Medland (she/her) Can you please expand on why you would not use precomputed PGS's?
*Thread Reply:* Thanks for your informative responses!
*Thread Reply:* Also, when you say "Remember these PRS are not independent of each other so the testing correction here is not /8." what correction would be advised then?
*Thread Reply:* the issue about PRS’s on different p-value thresholds not being independent and what correction to use. The problem is the correction will be somewhere between 1 and 8, but it’s not clear what it is. This is one reason why some people don’t like the p-value thresholding approach (and another is that it predicts somewhat less variance than a method that models LD explicitly), preferring instead an approach that yields a single PGS (e.g., MegaPRS, LDPred2, SBayesR). There are several recent reviews comparing PGS-building approaches.
*Thread Reply:* @Aislinn Bowler - I guess it depends what you mean by precomputed. If you mean someone gives you weights that have been precomputed in another sample then this will not give you the best prediction as the SNPs required for the PRS might not be available in your dataset and your samples LD structure might not be the same as the reference sample they used. If you mean computed in your sample by someone whose analysis skill you have confidence in then this is ok. Remember that even if this is the case as the end user analyst and author you still need to check through the code and analyses and make sure you are happy with how it was done. However, as it sounds like what you want to do is find the best predictor I think it's worth trying one of the methods that is designed for this purpose. Unless your target sample is exactly the same as the one used in building of the PRS your maximum prediction PRS won't necessarily be the same as the PRS that had maximum prediction when the PRS was built.
Also a Bonferroni correction is based on the number of independent tests - you can work out how many independent variables there are among your PRS using a method like this https://neurogenetics.qimrberghofer.edu.au/matSpD/

Hi, I have a question about the meta-analysis video. @Sarah Medland (she/her) In the last slide, you mention that RE meta-analysis is more appropriate than the inverse variance FE meta-analysis when we expect the effect sizes to differ between cohorts. But, how do we know that these effect sizes will differ, is there a way to know/check this beforehand?
*Thread Reply:* Sometimes you might expect this for example if you were running an analyses on a personality trait but all the cohorts had used different questionnaires and you thought they might be tapping different aspects of the same dimension. RE meta-analyses are very rare in GWAS.
*Thread Reply:* Okay, thank you, Sarah. 🙂
Reading this another question comes to my mind: So, the common procedure isn't to first try to run a RE meta-analysis and check if the model has a significant random slope and, in case this random slope isn't significant, stick to the FE meta-analysis?
*Thread Reply:* No - I would guess that <5% of GWAS meta-analyses projects ever try running a RE. This is partly because the RE meta typically has less power but mostly because there isn't a lot of software that can do this.
*Thread Reply:* In projects I've been involved in that ran both the results have always lined up and the RE analysis is reported in a 1-2 sentences that say that it confirmed the FE results.
*Thread Reply:* Ah, okay, great to know. Thank you!

*Thread Reply:* @Sarah Medland (she/her) it is a bit surprising to me to learn that "RE meta-analyses" are very rare in GWAS. I thought that it would make sense to assume effect sizes differ across cohorts, particularly if the cohorts come from different backgrounds (e.g., race/ethnicity/ancestry), given potential differences in environmental exposures/experiences across populations and GxE?
*Thread Reply:* Most meta-analyses focus on a single ethnicity - there are other meta-analysis techniques such as MAMA and MANTRA that are designed for cross ancestry analysis. The heterogeneity arising from ancestry is not well captured by an RE meta as in this situation it's usually the case that the variants that predict the trait differ somewhat between ancestries. The RE meta is looking for the mean of the effects not the median so it doesn't offer protection against the situation where the effect is truly present in some cohorts but not others. I think the main reason RE is less popular is that the FE is more powerful and the software for FE is easier to use. I can't check this as the manual pages of these programs no longer exist but from memory when running RE the software packages required you to manually align the alleles between data sets yourself - when you have 50+ cohorts going into a meta doing this much manual file manipulation is a recipe for human error. I think random-metal which is a recent program available from git carries over the automatic alignment that made metal the software of choice.
Note to the everyone 🙂 if you are writing a program/package please think about the search-ability of your software's name. Once the original link stops working it is really hard to find something if you use a common word as a title....

Not sure if I missed this somewhere, but I was wondering what the difference is between INFO score and r^2, for imputation? Thanks
*Thread Reply:* In general the name for the imputation accuracy metric is r^2. But if your data is imputed with miniMach it will be called Rsq, while if it is imputed with Impute it will be called INFO.
*Thread Reply:* Great, thanks!

Great PRS intro video! I wonder, what would be an example trait, where we see such drop of effect when including less significant SNPs? Are there some traits, where most SNPs have been mapped with such confidence?
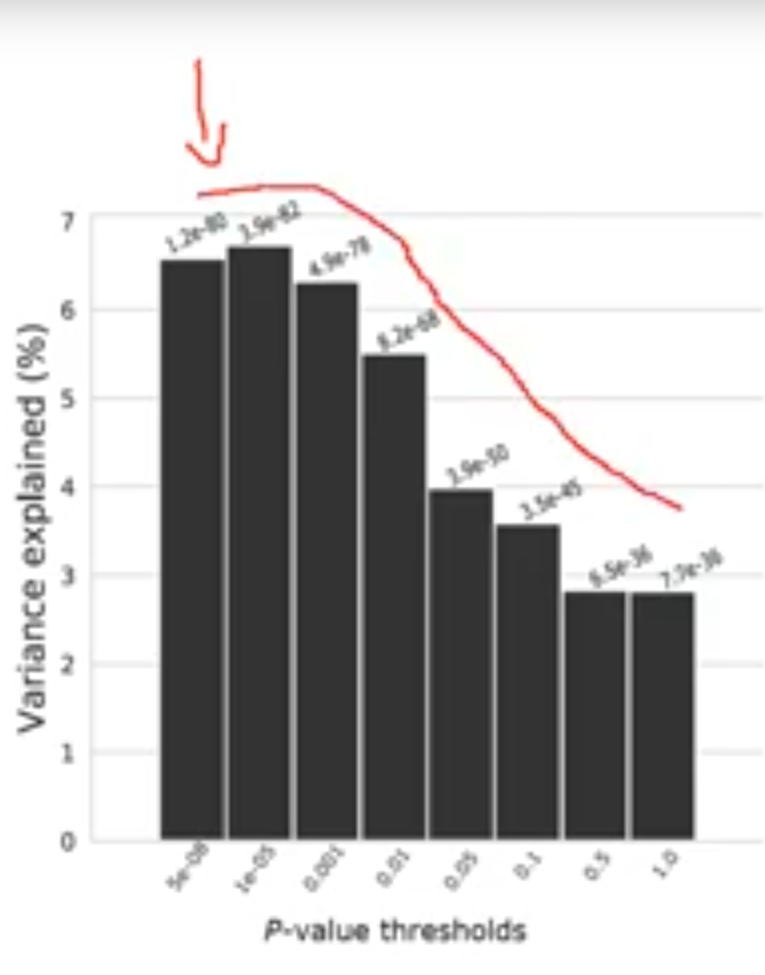
*Thread Reply:* Hi - you sometimes see this shape in traits that have very few variants influencing them or gene effects. In this case adding more variation can mean adding noise and reducing the predictive ability of the PRS
*Thread Reply:* Thanks! I was wondering, if it would be realistic for polygenic traits?

*Thread Reply:* Wouldn't this also be the pattern even for a polygenic trait if the GWAS is very well-powered?
*Thread Reply:* Perhaps yes, but I wonder if such traits exist yet
*Thread Reply:* Hi @Uku Vainik. This particular example is from a recently published vitamin D GWAS predicting in an Australian sample. https://www.nature.com/articles/s41467-020-15421-7/figures/2 (light blue bars)
If I use a case-control GWAS for polygenic scores, can I still include the control sample of the original GWAS in a control-only PRS analyses? For instance,I'm interested in schizophrenia (SZ) PRS - personality trait correlations in Estonian Biobank (EBB). EBB particiated in the original GWAS with 200 cases and some controls. If I exclude the 200 SZ cases in EBB and do the SZ PRS -personality trait correlations in the control sample, do I risk any bias?
*Thread Reply:* No! Unfortunately not. Any overlap regardless if it comes from cases or controls will lead to inflated r2 and p. It takes only 2 or 3 people to start seeing this bias. If you contributed to a GWAS Meta-analysis you should be either able to ask for a leave-one-out analysis OR if you have the original GWAS sumstats you can subtract your data from the meta yourself.
In case people are wondering about the naming PRS is the same thing as PGS. Some people thing that risk doesn't make sense if the outcome is continuous so they call it a PolyGenic Score. I personally think of risk as a continuous liability so to me the name PRS makes sense for both ordinal and continuous outcomes (https://en.wikipedia.org/wiki/Threshold_model#Liability_threshold_model)
*Thread Reply:* A recent trend is using polygenic indices https://www.biorxiv.org/content/10.1101/2021.05.08.443158v1
*Thread Reply:* that's one I've never hear before but sure, also polygenic predictors has been used a few times
*Thread Reply:* Isn't is also related to the word "risk" suggesting it is a negative trait which is not appropriate for traits/diagnoses like Autism?
*Thread Reply:* @Aislinn Bowler, yes, for this reason people try to find other options:
In this paper, we use the term ‘polygenic index’ instead of the commonly used terms ‘polygenic score’ and ‘polygenic risk score’. Most of us prefer the term ‘polygenic index’ because we are persuaded by the argument that it is less likely to give the impression of a value judgement where one is not intended. The term ‘polygenic index’ was first proposed by Martha Minow at a meeting of the Trustees of the Russell Sage Foundation.
*Thread Reply:* There is a lot of variation in this space. Risk will stay a negative if we only use it this way. Using it in the context of risk of possitive outcomes too helps de-stigmatise the word.

Hello! I have a naive question here about A1 and A2 on GWAS summary statistics. It seems like there are different names for them, e.g. effective allele vs non-effective allele, reference allele vs alternative allele, and sometimes it’s a little hard to get around with these as A1 is not necessarily effective allele according to some READMEs I encountered.
Can we safely say that effective allele and alternative allele are the allele in which the effect size (e.g. OR) is referring to by having that allele? Thank you! 🙂
*Thread Reply:* As you say, A1 is not always the effect allele. And the naming of the alleles is often different across different programs. At this point, I would not encourage any assumptions about which allele is the effect allele. I recommend checking the information from the program and if you are looking at summary statistics and it is unclear, then email the author 🙂 Much better to check.
*Thread Reply:* It would be great if the field would have chosen early on conventions about which allele will be the reference (e.g., always the minor allele averaged across ancestry). But that unfortunately wasn’t done, so as Katrina says, you can’t make any assumptions. Note that it would be impossible to consistently make one allele the “effect” or “increasing” allele because that depends on the trait and sample.
*Thread Reply:* This is very helpful! Thank you both! 🙂
*Thread Reply:* Jumping off Kai's question - so if we had the alleles labeled "A1" and "A2," and wanted to determine which was the reference and which was the alternate, we should be going into a browser to figure this out, correct?
I have a situation where I'm trying to compare two datasets, one which has REF/ALT and other A1/A2. The latter README indicates A1 is the effect allele, but I wasn't sure whether this meant that this is the allele associated with disease and could be considered the alternate (and by extension, that A2 is the reference), or not.
Apologies if this is a naive question; I'm new to working with this type of data. Thanks!
*Thread Reply:* I don’t think you can just go into a browser to figure out which is REF and which is ALT because those distinctions are arbitrary and differ across arrays/imputations/etc. These types of situations where you need to match SNPs across datasets occur constantly in our field and are a headache. There is a program called liftover that purports to do this, though I haven’t used it. If you have documentation associated with your files, you can use that to try to figure it out. Whichever way you end up doing this, you’ll want an independent check afterwards to make sure that things look OK. A typical way to do this is to plot REF freq from sample 1 against REF freq from sample 2. The plot should fall along the slope = +1 line and have a corr > .9. If instead you see an “X” pattern, you know that it failed. If you see a small number of SNPs falling in quadrant 1 and 4, then there was some problem with those SNPs.
*Thread Reply:* I see, thank you very much!
https://qimr.az1.qualtrics.com/jfe/form/SV_57iJKVtD3y0fQns

*Thread Reply:* Hi @Sarah Medland (she/her), could we have that tutorial also as a PDF file, so we can download it to our computers?
*Thread Reply:* It will be available as a pdf when it is made public after the course. A lot of people are finding code doesn't work when copied from a pdf because of the pdf software/os they are using. Copying from a webpage doesn't have these issues.
Is there a resource out there that provides coding solutions, resources, etc., for formatting GWAS sum stats that are missing various elements? For instance, say a sum stats file comes with Chr:pos but your software requires rsID. Or your sum stats includes Z-scores and you need betas. Or it is missing MAF altogether. I know that there are individual solutions to all of these problems, but a singular location for all of the fixes sure would be convenient, ya know?
*Thread Reply:* No there is no one place where these solutions have been centralized as an FAQ. I think many situations are very situation specific but this could be done.
*Thread Reply:* This is something that I would like to put together. I doubt it would be comprehensive, but at least a starting place for common scenarios...
Hi! I have two very basic questions about the video of imputation and hope someone can help me to understand them: 1. why some variants were not genotyped on a chip (slide 3)? 2. In the Michigan Imputation Server picture, I saw that we can choose "population" such as EUR. What if my dataset contains mixed-race samples? Thank you for your help!
*Thread Reply:* For an European ancestry or majority European samples I always recommend running the ALL ethnicities references. If you have a majority Asian ancestry sample or a majority African ancestry sample you might get better results from an ancestry specific reference but in other situations I would run the ALL ethnicities references every time.
*Thread Reply:* Hi Grace A chip might genotype hundreds of thousand loci (300-500 thousand covers the range of many but there is quite a variation in how many loci and which loci are genotyped on any particular chip). And as I wrote this I see Sarah has answered Q2 🙂 With imputation, we are able to "recover" information on the other variants. Often we can get 8-10 million loci (depending on the quality of the imputation)
*Thread Reply:* missed Q1 - there are 200million+ SNPs it is too expensive to genotype them all and not required since that can be imputed.
Apologies if I've missed this but are there any practicals for today's session? Thx
*Thread Reply: To get started ssh into the workshop server. Use mkdir to make a working directory for today's tutorial and copy the files from /faculty/sarah/2021/MA_PRS/ to your working directory. cp /faculty/sarah/2021/MA_PRS/* ./
*Thread Reply:* Also you'll need this https://qimr.az1.qualtrics.com/jfe/form/SV_57iJKVtD3y0fQns qimr.az1.qualtrics.com 2021 International Statistical Genetics Workshop - Meta-analysis and PRS 2021 International Statistical Genetics Workshop - Meta-analysis and PRS
Yes. To get started ssh into the workshop server. Use mkdir to make a working directory for today's tutorial and copy the files from /faculty/sarah/2021/MAPRS/ to your working directory. cp /faculty/sarah/2021/MAPRS/** ./
in response to Christina's following question:
Given that individual effects from the discovery sample would be a mix of positive and negative values, that you are then summing, is there concern that you are sort of washing out or muddying the total score? Would there be any benefit in selecting only positive effects (or only negative effects) to create the PRS or would that cause other problems?
I would say that the positive or negative effects is that the reference allele for the regression is arbitrary [i.e., we could just as easily have an A/C variant that is the number A alleles or the number of C alleles] - so given the sign is arbitrary it is more important to include the variants with stronger evidence for being associated. Beyond that there are considerations of regularization [i.e., what you change the weights of the SNPs to]"
Hi, thanks for the excellent tutorial today - very helpful. Would it be possible to see the code used to derive the ancestry principal components from the PRS half of the tutorial? Sorry if I missed this somewhere.
*Thread Reply:* Hi - there are a few ways of doing this. In day3 you made MDS and these function the same way as PCs in an analysis. https://www.cog-genomics.org/plink/1.9/strat#pca The most common software used to make PCs is eigensoft/eigenstrat - you can find a tutorial for this here https://gaworkshop.readthedocs.io/en/latest/contents/05_pca/pca.html Another way of doing this using software that you've used in the workshop is to use GCTA https://cnsgenomics.com/software/gcta/#PCloadingandprojection
*Thread Reply:* Ah, wonderful. Thanks, Sarah! I will take a look into these additional resources.
I enjoyed today, but have a couple questions about PRS methods:
- I have seen papers using the C+T approach that calculate scores across a number of thresholds, run a PCA on the scores, and then use the first PC in subsequent analysis. This seems like a nice way to obtain a single score, but wanted to get thoughts on this versus other possible approaches.
- I am interested in calculating pathway-based PRS using SNPs belonging to relevant gene sets. PRSice2 makes this fairly straightforward using C+T, but are any of the PRS methods mentioned in the lecture particularly good or bad for this purpose?
*Thread Reply:* Hi - these are my thoughts others might disagree
- I don't like this idea as typically all SNPs in PRS1 are subsumed in PRS2 etc. I also think this opens the doors to overfitting unless the PCA is run on an independent sample - so you'd need 3 'samples' for this - discovery, pca training and target.
- Not that I know of - you can 'hack' all these programs to get them to do this be restricting the input data. That being said gene pathways are only as good as their curation so be careful on the source of your pathway information if you were planning to do this at an 'all pathways' level of analysis rather than an small number of high quality pathways level.
*Thread Reply:* Thanks for the reply! Regarding number #1, I merged the 1000G EUR subjects with my target dataset and calculated PRS for all subjects. If I were to run the PCA on only the 1000G subjects and apply the loadings to the may target subjects, would that be a reasonable approach or still not recommended? If it is still potentially problematic, that would be a good motivator for me to try the other approaches that produce a single score.
*Thread Reply:* Hi - I think it depends on how the weights are set up. If they are subsets of one another I feel that this would still be an issue. If your weight sets were pathway based or independent maybe this would work better.
*Thread Reply:* Ah, I see. Yes, they are subsets of one another so still an issue. Thanks for your advice!
Hi, I had a question about how to obtain the p-values from the PRS assignment. In the online manual you already provide the table with the following values:
Lastly we're going to make some plots. First we will plot the Nagelkerke R-squared by threshold.
 # Data
 r2 <- data.frame(
 name = c("1e-06","1e-04" ,"1-e02","1"),
 Nagelkerke_R2 = c(0.174748, 0.198440,0.236648, 0.269725 ),
 P=c(3.16e-10,2.35e-11,9.09e-13,5.59e-14)
 )
I manage to obtain the values for NagekerkeR2 from the data, but I obtain a different set of p-values. The code I use is the following:
```R2 <- nagelkerke(ADPRSa, null = Null, restrictNobs = FALSE)
R2$Pseudo.R.squared.for.model.vs.null[3]
[1] 0.174748 as in the above code
R2$Likelihood.ratio.test[4]
[1] 4.1235e-12 doesn't match the above code```
*Thread Reply:* Hi Lucia, I think the p-values are the p-values for the AD_PRS when running the model, not the p-values for the R squared.
```data$AD[data$AlzheimerDisease=="1"] <- 0 data$AD[data$AlzheimerDisease=="2"] <- 1
summary(glm(AD~AD_PRSa+PC1+PC2+PC3+PC4, data=data, family = "binomial"))``` Should return the following as p-values for the PRS:
Coefficients:
              Estimate Std. Error z value  Pr(>|z|)
(Intercept)     1.3849     4.2293  0.3275   0.74332
AD_PRSa     10419.4552  1386.0699  7.5173 5.593e-14
Hope that helps.
*Thread Reply:* Yes, now I get the values, thanks a lot. 🙂

Thanks so much for this session. Q re PRS: Do we think in the future we will aim to have one PRS for each phenotype for all humans regardless of ancestry. Or will we have multiple PRS for each phenotype that are specific to different ancestry groups. With the latter, wont there still be large groups of people for whom the available PRS are not suitable for them. Thanks!
*Thread Reply:* It’s a good question and am curious to hear what others think. I’m thinking it’s going to be a sliding scale. To the degree that we eventually nail down the actual causal variants, then maybe it won’t make much of a difference. But in our lifetimes, PRS’s built specifically for different ancestry groups should continue to outperform PRS’s built for all ancestries. So probably different PRS’s for different ancestries.
I think this is true even though we will probably be better off using all the information in all the discovery samples we have. I.e., using a good ancestry-aware method on a larger mixed-ancestry discovery samples is likely to work better for all target samples than smaller ancestry-specific discovery samples (e.g., you still get some additional information on which SNPs are important in AAs even from a pure EA sample), but the exact weighting of SNPs will differ depending on the ancestry composition of each target sample. So still different PRS’s for different ancestries, even though I think we’re moving towards being able to use combined discovery samples.

is there a good meta-analysis tool that corrects for sample overlap?
*Thread Reply:* (moving this to the right thread) metal with the sample overlap flag https://genome.sph.umich.edu/wiki/METAL_Documentation#Sample_Overlap_Correction
*Thread Reply:* One gotcha - If you do this sequentially you need to use the new estimated N not the weight column as the N for the next step
*Thread Reply:* METACARPA has a similar adjustment for sample overlap, but it works with effect sizes and SEs instead of N-weighted p-values. https://www.sanger.ac.uk/tool/metacarpa/
*Thread Reply:* Another approach is MTAG, which uses LDSC to correct for sample overlap https://github.com/JonJala/mtag
*Thread Reply:* Will look into these. Thanks, @Sarah Medland (she/her) and @Mark Adams!
*Thread Reply:* would it be possible to look at an example script with METAL using OVERLAP ON? when I provide it as an option, I get this output: ```OVERLAP ON
ERROR: The command you issued could not be processed ...```
*Thread Reply:* You'll need to get a new version (the linux version available to download from the UMICH server is from 2011). I'm not sure if there is readily available binary for the newer version but its possible to build from source: https://github.com/statgen/METAL
*Thread Reply:* perfect, thanks!

Thanks for this session, it was really helpful - I was going back over some of it and had a bit of a specific question. It was mentioned that if you had summary statistics that only included z-scores it's possible to estimate beta and SE. Would it also be possible to estimate odds ratios if the trait in the GWAS was binary? Am I right to assume it wouldn't be appropriate to estimate a beta in this scenario?
*Thread Reply:* If you have a beta, you can always get odds ratio as OR = exp(BETA). I'm not sure about the first question and would be curious to learn if there are any useful formulas. Just based on a Z statistic, you can't determine what the beta and the standard error were without more information (since, e.g, beta = 2 and se = 1 has the same Z as beta = 10 and se = 5. My assumption is you'd need to know the sample size and allele frequency to reconstruct the beta and se from the Z score.
*Thread Reply:* Thank you, I think I was just confusing myself. I had found a formula for estimating SNP effects from z-scores using sample size and allele frequencies in the supplementary material of this paper (https://www.nature.com/articles/ng.3538#Sec19) but this assumes that the phenotype has been standardized to mean of 0 and SD of 1 so I wasn't sure if that would still be appropriate to use if the summary statistics are from a case/control GWAS.