Public Channels
- # anonymous-question-box
- # ask-the-admin
- # day01-intro-genomics-biometric-model
- # day02-sem-study-design-phenomics
- # day03-quality-control-gwas
- # day04-heritability-and-gcta
- # day05-meta-analysis-prs
- # day06-genomicsem
- # day07-causal-modeling-mendelian-randomization
- # day08-sequencing-introduction-to-hail
- # day09-rare-saige
- # day10-pathway-and-gene-based-analyses
- # documentation
- # f-abcd-repronim-course-videos-instructions
- # f-creation-of-videos
- # general
- # python-intro
- # random
- # session-a
- # session-b
- # technical-support
Private Channels
Direct Messages
Group Direct Messages

@Jeff Lessem (he/him) has joined the channel

@Lucía Colodro-Conde has joined the channel

@Katrina Grasby has joined the channel

@Baptiste Couvy-Duchesne has joined the channel


@Elizabeth Prom-Wormley has joined the channel

@Margherita Malanchini has joined the channel

@Abdel Abdellaoui has joined the channel


@Adrian Campos has joined the channel


@Jodie Painter has joined the channel

@Test Student has joined the channel


@Sarah Brislin (she/her) has joined the channel


@Katie Bountress has joined the channel

@Peter Tanksley has joined the channel


@Charlotte Viktorsson has joined the channel


@Matthieu de Hemptinne has joined the channel


@Sam Freis (she/her) has joined the channel


@Stephanie Zellers (she/her/hers) has joined the channel


@Zoe Schmilovich has joined the channel

@Olivia Rennie has joined the channel

@Christina Sheerin has joined the channel

@William McAuliffe has joined the channel


@Francis Vergunst (he/him) has joined the channel


The link to this day's web page and videos is at https://www.colorado.edu/ibg/international-workshop/2021-international-statistical-genetics-workshop/syllabus/day-3-wednesday
Hi Everyone! If you have any questions while watching the Quality Control and GWAS videos you can post them here. Looking forward to meeting you all 🙂

Hi, could you post the code for ssh client to copy everything for day 3 (ahead of tomorrow) please?
*Thread Reply:* No problem. I just pinned a google doc into this channel with the instructions on how to get those files 🙂

Hi! I’m not sure if this best place to ask this question, but I was hoping someone could point me to any GWAS that exist on phenotypes similar to Effortful Control. It doesn’t seem like there is a GWAS on Effortful Control itself yet, so at the moment what would be the closest proxy for a strong GWAS using related phenotypes?

*Thread Reply:* Feels a bit more like you want general or random channels, so may want to repost. But I can answer here 🙂. If you do repost there, if you could give some common behavioral correlates that would help jog others memories as well. I did a GWAS of common executive functioning which is correlate, but unpublished as of yet. That might help? https://www.biorxiv.org/content/10.1101/674515v2.full
*Thread Reply:* Thanks so much for your response! I think inhibitory control specifically is a bit closer to the construct I am trying to tap as it is more tied to temperament and affect. It looks like there are three GWASes of inhibitory control (https://www.ebi.ac.uk/gwas/efotraits/EFO_0008467) but they do all have much much smaller sample sizes, comparatively.
*Thread Reply:* I agree, but Common EF (phenotype in the GWAS) and inhibitory control are isomorphic. see: https://www.ncbi.nlm.nih.gov/pmc/articles/PMC3388901/
@Jeff Lessem (he/him) has renamed the channel from "quality-control-gwas" to "day03-quality-control-gwas"
Hi Everyone!
Here is a google doc with some instructions on accessing the day 3 practical -- if you want to access it in advance of our practical 🙂
https://docs.google.com/document/d/1YzulM3I4MNegzxYloMDTlLoK9KY8W6_pVddMF5c7xe8/edit

*Thread Reply:* Seams to have closed access
*Thread Reply:* It should work now! Thanks for letting us know

*Thread Reply:* Hi, I am not able to sign in to the RStudio. For day 3, I tried running the copy command (cp -r /faculty/katrina/2021/QC/) in Putty to copy the files but it throws an error. Should I copy and run the command in RStudio terminal?. Thanks
*Thread Reply:* Sorry, I missed the period at the end of the copy command and it did not copy the QC files. Now I could copy the QC files. But, when I run this command, cp -r /faculty/katrina/2021/GWAS/ . It says there is no such file or directory. Are the GWAS files there in the directory?. Thanks
*Thread Reply:* Oops The GWAS is in Lucia's folder. I'll fix the google doc! cp -r /faculty/lucia/2021/GWAS/ .
THANK YOU for finding the typo!!
*Thread Reply:* I"m not sure about the Putty problem. Have you had trouble with using cp wth Putty in the other pracs?
*Thread Reply:* Sorry, I didn't include the period (.) at the end of the copy command and it was throwing an error in Putty. Now everything is copied. Thanks
*Thread Reply:* This is a really useful document @Katrina Grasby, thank you

Hi @Lucía Colodro-Conde / @Katrina Grasby, in one of the talks you mention that "SNPs can move between builds", i.e., that a SNP (rs..) had location A in one build, but is on location B in the next, updated, build. How does that work?

*Thread Reply:* Each build incorporates more data and so the mapping of variants improves as the amount of data increases. Back when we were running linkage (prior to the development of the chips used for GWAS) they used to put the chromosome number in the variant name (ie D3S123 was meant to be on chromosome 3 and D4S356 was meant to be on chromosome 4). Now if you go back to those variants in recent builds you find that many ended up on the wrong chromosome. These days it's common for possitions to shift between builds but very uncommon for markers to change chromosomes.
*Thread Reply:* Hi @Jet Termorshuizen, During the build information is assigned to the genome sequence (e.g. start and stop positions). The assemblies keep updating and the information gets revised as we learn more about the genome. The reason updates are happening is that more markers are getting sequenced and confirmed over time. We don’t have 100% complete sequence across every single position in the entire genome and each build is filling in gaps. If you compare the same rs number across builds, the numbers for a position go up with each build as a result of more markers being added. The rs number stays the same, the position number can change across builds (so rs numbers are more stable, although this is not an absolute). ☀It's very important to check which build we're working with ☀ (we'll check this in the practical). You can use the LiftOver tool (https://genome.ucsc.edu/cgi-bin/hgLiftOver) to change your data from one assembly to another if needed.
*Thread Reply:* Ok - found an example of a microsat that changed chromosome. D3S2390 was initially mapped to CHR 3 but in the canonical "Marshfield human genetic maps" this marker was re-assigned to the X chromosome.
*Thread Reply:* There are also some resources that can be used to exclude SNP/regions that are unstable across genome builds https://github.com/cathaloruaidh/genomeBuildConversion
One other question: I often hear that the quality of DNA obtained from spit is poorer than DNA obtained from blood. Is this (still) true? And if yes, why is that?
*Thread Reply:* Yes, this is still true. Blood is a gold standard as a source for DNA. Spit (saliva) contains more proteins and bacterial DNA that makes it more challenging to amplify DNA for genotyping. Nevertheless, we use spit often because it is a less invasive approach for collection. Also, the newer technologies for acquiring, storing, and using saliva reduce some of the previously mentioned issues. Practically speaking, saliva is also easier to ship if you're doing very large scale data collection. Therefore, DNA collected from saliva is a very strong source and is an excellent alternative to blood.
*Thread Reply:* Agreed - modern saliva collection kits are stable in an air-conditioned space for ~5 years before processing. The can be easily shipped through the post. If your plan is to do a GWAS saliva is great. If your plan is exome sequencing it's ok. If your plan is whole genome seq it's not the best option.

I have two questions about the "Genotyping Intensities" slide in the "Quality Control" video.
- What are the axes of scatterplots describing? Also, their definitions seem to vary between plots.
- Does NA correspond to the missingness of a phenotype? Because, if their genotypes were missing, they wouldn't be on the scatterplot in the first place. Am I right?
*Thread Reply:* Hi,
*Thread Reply:* The axes describe the intensities measured for allele A and allele B. You want to group the samples into three clusters: AA, AB and BB. This is not done by eye because it would take a long time and it would not be an objective process. So we rely on clustering algorithms that will classify the data into one of the three groups based on their intensity. So basically NA are set to NA because they cannot be assigned to a group. Those samples still have intensities so there is data to visualize them, that is why they are still in the scatter plots.
*Thread Reply:* For question 2: the phenotypes are handled separately to the genotypes. Phenotypes with NA does mean the phenotypes are missing. Those individuals will be included in most of the qc (with the exception of HWE, as the default is to do this on controls when analysing case control data) but won't be included in your later association analysis.
*Thread Reply:* @Adrian Campos @Jodie Painter Thanks very much! So those labels were the results of clustering. It's all clear now. Also, thank you for pointing out about case-control studies. I have never thought about missing phenotypes affecting HWE testing.
Hi, in which situation would you perform the HWE test in the whole sample vs. only in controls? Does it only depend on ascertainment? If we have an ascertained sample, we would often break HWE by selecting for case-associated variants, right?
*Thread Reply:* Ascertainment is the main deciding factor. In a sample recruited for a case control study you would typically restrict the HWE analyses to the controls. Another thing to consider is relatedness - typically you would only run the HWE analysis in the founders if you have collected data from families.
*Thread Reply:* Great question, Emil. Yes, it advised to test for HWE in controls because we assume that controls are closer to the general population than cases, notably because of their ascertainment. In fact, you can always imagine running a case-case analysis (say, bipolar disorder vs schizophrenia), in which case the concept of "control" becomes a bit fuzzy. In this practical, the idea is to detect strong departure from HWE, which could be due to technical errors. In practice, it's important to think about ascertainment in controls too as you've rightly underlined.
Another more meta-question: A recent paper argues that GWAS is getting less transparent and QC procedures are getting less standardised, potentially jeopardising the validity of its results. I just wonder if someone has an opinion on this and how it can be prevented (I guess this very workshop session helps keeping QC standards in check 🙂)
*Thread Reply:* It is the case that QC and best practices have evolved since the start of GWAS. Thresholds and filters that were appropriate for samples of <10,000 don't necessarily work for samples >1M. It is also the case that many GWAS papers do not describe their QC and analysis procedures well or in depth when previously this might have taken 1-2 pages of supplementary material to describe. Unfortunately it is also the case that as GWAS data has become more accessible it is more common for analysts to work in a situations where no one in the group has expertise in genetics or biology - this usually leads to problems because they don't know what they don't know.
*Thread Reply:* I think you need to consider each point in that paper carefully as I think some of the comments are presented in a way that is a bit misleading.
For example the paragraph about imputation accuracy r2. Background on this: When imputed data you get genotypes in 3 formats 'dosage data' (ie count of the alternate alleles), genotype probabilities (which is given as 3 probabilities) and hard-calls (which is the best guess of the genotype). Dosage and Probability data incorporate the uncertainty of the imputation into the data. Hard-calls do not. Best practice is to run your GWAS on the dosage or probabilities.
If an analysis uses an r2 threshold of .9 this is a signal that they have run the GWAS on the hard-calls rather than using the dosage or probability data. This is not a good thing. However, it is also horrendously wrong to apply a r2 filter of .1. Currently we usually use a threshold of .6.
The statement that "imputed SNPs that pass the threshold are not treated any differently from measured SNPs, and imputation quality scores are not included in GWAS" is misleading and untrue if the GWAS is run on the dosage or probability data as the uncertainty associated with imputation quality is inherent in the data for that SNP.
*Thread Reply:* Also to note, there are different stages in which we apply QC to our data. In the session today we focus on QC of the genotyped data, prior to any analysis (and imputation). QC post GWAS of imputed genotypes will be discussed on Day 5 :)

I have a question about batch effects. UKBB has an ID for genotype batch and it is quite standard to included this as covariate. As the number of batches is quite high, I discovered that in the end this ID often gets reduced to genotype array e.g. just a binary covariate so I always wondered how big of a bias this will introduce.

*Thread Reply:* sounds like a great paper/letter!

*Thread Reply:* What do you mean by “reduced to”?
*Thread Reply:* UKBB has 2 main arrays with 11 and 70 batches per array I think. So instead of including these as covariates only the overall array info (coded as 0 /1) is used and I just wondered if this is an OK approximation.
*Thread Reply:* First Q I would have is whether batch correlates with specific outcomes…
*Thread Reply:* it’s probably best to control for batch. In the UKB, you have plenty of degrees of freedom to spare so it is typically better to play it safe and control for batch. Also, I believe that array is nested within batch. If so, you can’t control for both batch and array explicitly in the same model bc the moment matrix (t(X)X) would be singular ; by controlling for batch, you implicitly also control for array. To see why: say you have 4 classes, 2 all female 2 all male (F, F, M, M). You want to control for class, which has 3 contrasts. One of those contrasts might be 1, 1, -1, -1. A second might be 1, -1, 1, -1. And a third 1, -1, -1, 1. Note that the first contrast is also a contrast for sex. Ergo, you can’t control for both the nested and the nesting variable in the same model.
*Thread Reply:* Batch is worth entertaining as a covariate if you are working with the intensity files or called genotype data. Batch effects largely get cleaned up in the imputed data where miscalls are fixed.
*Thread Reply:* Many thanks for all the answers - super helpful for some of my upcoming studies.

Hi @Lucía Colodro-Conde, thanks for the great videos. I have a question, do we have to download plink for the practical? Thanks!
*Thread Reply:* It is preferred that you run your analyses on the workshop server. You'll connect with your SSH client and do most of the work at the terminal.
*Thread Reply:* So you don't need to download anything to your local computer, just connect to the workshop cluster.
@channel - This is today’s channel 🙂
Hi, @Lucía Colodro-Conde How is sample call rate plotted? Thanks
In qc-plots.R there is some code for plotting the frequency of individuals by how much missing data they have (is that your question?)
Is it true that the effect allele is usually the minor allele?
*Thread Reply:* By default in Plink! But not in other programs. Check the original GWAS paper to figure out the software and look for those defaults. If you don’t know, most groups include additional documentation with that information.
*Thread Reply:* Good opinion paper on this topic: https://academic.oup.com/ije/article-abstract/49/5/1734/5900777
*Thread Reply:* Older software would often recode the minor allele to be the reference allele, and thus it would become effect allele when running a GWAS, but that isn't a safe assumption anymore.
*Thread Reply:* Another major factor here is the imputation panel and imputation software. In some panels they deliberately formatted the data so that the 1st allele would be the minor. You should not assume the effect allele is the minor allele.

Do you have any recommended reading for understanding and interpreting QQ plots?
*Thread Reply:* the wiki page has a good description: https://en.wikipedia.org/wiki/Q–Q_plot

*Thread Reply:* strange; slack misinterprets the link, but you know it
@channel with today's practical for the second session starting soon. If you can copy the practical materials to your working area in preparation, that would be helpful.
mkdir day3 cd day3 cp -r /faculty/katrina/2021/QC ./ cp -r /faculty/lucia/2021/GWAS ./
for question 4.1.4 of the day3practicalpart1 pdf, is there a reason for the specific p-value used for determining variants that significantly differ in missingness between cases and controls? I've seen this value before, but had wondered if it was arbitrary or just a practical value?
Great question! And I doubt I have a terribly satisfactory answer for you. As far as I'm aware it's arbitrary... like so many of our p-value thresholds
thank you! great to know that the value I've used in the past is the right one, even if it's just because of previous precedent
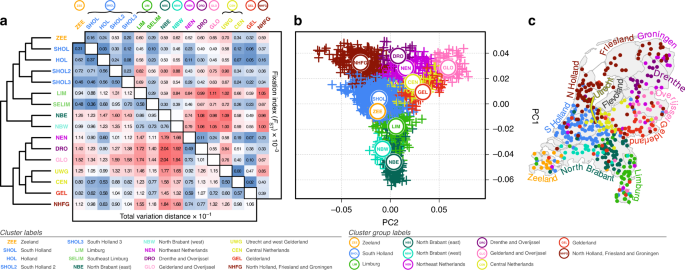
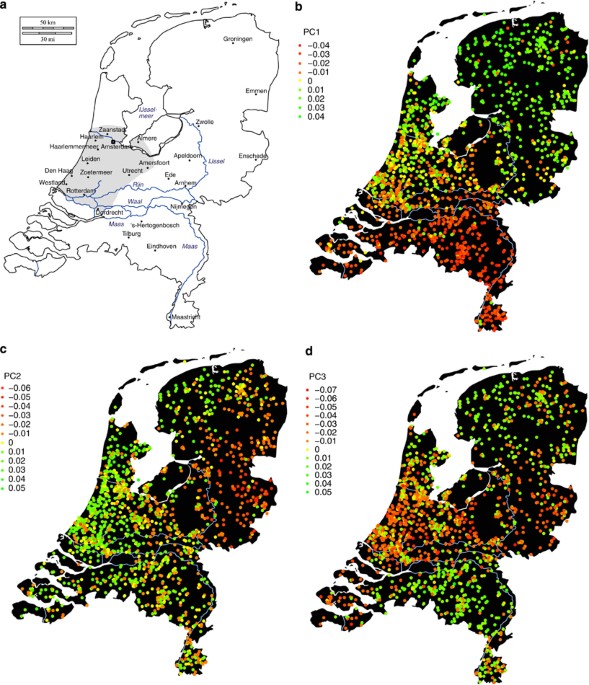
Just wanted to share these papers we were discussing in the after tutorial breakout rooms. https://www.nature.com/articles/s41467-020-18418-4 & https://www.nature.com/articles/ejhg201348
As an example of how PCs can be useful even when you're doing analysis within one given ancestry

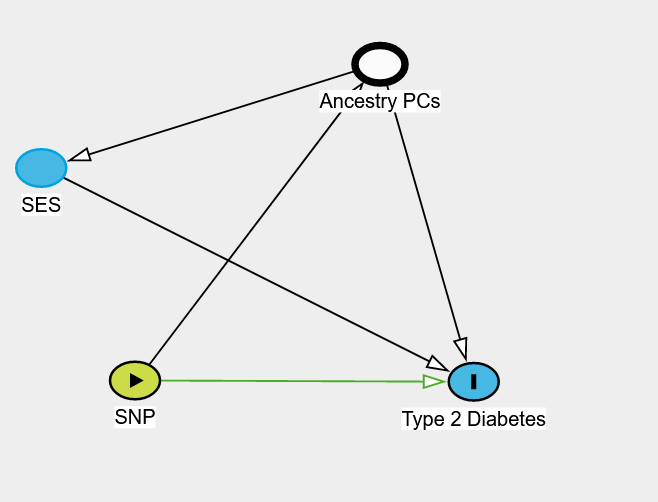
*Thread Reply:* These are really interesting papers thanks for this! Just wondering but can PCA also help to remove or unpick confounding effects of population stratification that occur due to SES status/class divides in a population like it can for migration and geography?
*Thread Reply:* I think the answer here depends a little bit on what type of analysis you are doing. If you are running a GWAS then it is often not recommended to adjust for heritable traits (such as SES). But if you are interested in the association between a SNP and let's say Type 2 Diabetes you might think the underlying model is something like this DAG I've pasted below. Here SES is influencing the risk of Type 2 Diabetes, which is also influenced by ancestry. And so adjusting for the ancestry PCs you'll block the path going between the SNP (thought ancestry) to SES and finally to the outcome Type 2 Diabetes.
Hope that is a little bit clearer - feel free to ask again if it is not!
*Thread Reply:* Thanks for this great explanation.. so is it correct that adjusting for ancestral PCs you adjust for any population stratification that is influenced by intergenerational class divides but that won't remove SNP effects that are genuinely influencing SES? So then say if you wanted to understand how SES might share a genetic component with type 2 diabetes you could adjust for PCs and then do LDSR or other analyses to explore genuine shared genetics rather than those due to population stratification? I'm asking because my lab group is really interested in this (though its more clinical than genetics based) but one of the PIs thought it would always be confounded but I thought that maybe you remove issues of population stratification with PCA but I'm not sure if I'm right or not so want to properly understand! 😅
*Thread Reply:* Yes, I think if you are interested in the shared genetic component I would run the GWAS with the PCs and then run LDSc with your other trait of interest (such as a measure of SES). If you're interest is in causes of trait 1 on trait 2 you might also consider running a Mendelian randomization
*Thread Reply:* Fabulous thanks so much for clarifying this for me, really appreciate the clear explanations! 🙂
I was curious about the impact of filtering out ambiguous alleles. I imagine this would get rid of a substantial number of variants. Does this not have a substantial impact on results because other variants in LD with ambiguous variants are likely to pick up the effect in their absence?
*Thread Reply:* it’s a good question. removing ambiguous alleles should remove about 1/3 of SNPs: AT - ambig AC AG TC TG CG - ambig However, as you note, in many cases (such as HE reg, GREML, GWAS), this doesn’t have much influence on results because of LD. But there are exceptions. Perhaps the most obvious one is when looking at rare variants when many variants just don’t have much LD with other variants, in which case you could be losing important signal. Perhaps there are other scenarios faculty can think of?
*Thread Reply:* Also, think about when you are removing ambiguous alleles and why. Removing for the purpose of looking at population stratification is different to looking at GWAS signal. Removing pre-imputation is different to post-imputation. Post meta-analysis, think about how the variant is being processed by the program and if you can disambiguate with frequency. Have a look at ancestry and allele frequency and if this affects how readily frequency can be used to disambiguate...

*Thread Reply:* Just to follow up on Matt and Katrina's answers- the number of palindromic SNPs (A/T and C/G SNPs) on many arrays is often far less than the expected value of 1/3. One of the reasons is that Illumina Chips that employ the Infinium II single base extension chemistry don't (can't) detect A/T and C/G SNPs. c.f. Steemer and Gunderson 2006. So at least in some cases removing palindromic SNPs does not make much of a difference to overall SNP numbers.
*Thread Reply:* thanks David! You (re)learn something every day. I’ve probably noticed this before, not understood the reason, and forgotten it. But to put it in perspective, the base expectation of palindromes is 1/3 and the observed one on arrays is something like 1/6? But it’s not 1/24 or something like that…
*Thread Reply:* These are very helpful, thank you for the replies!

Hi Katrina and Lucia, thanks for a great session, it was really clear. Lana and I have just finished practical Part one - QC (which as beginners took us about 4 hours, not 30 mins!!) . We are a bit confused about how to interpret our results on ancestry - q9. Should we paste our outputs (table and r plot) here, or discuss offline? Thanks, Kristen & Lana
*Thread Reply:* What do you make of your ancestry results? If you are happy to discuss here, then others can benefit from the discussion...

Thank you for the helpful lecture and practicals yesterday! I’m wondering where I could find those slides during the lecture session? I noticed that they are a bit different from those posted on the website.
*Thread Reply:* Sure! The slides we had up during the practical are located at /faculty/katrina/2021/QC/day3practicalpart1.pdf
Hi! I have a question about the GWAS practice in Day 3: When I tried to run the code under 1.4 to get the allele frequencies separately for cases and controls by adding the "case control" modifier to --freq, I entered the following code in my command line: "plink --bfile adclean.cc --logistic hide-covar beta --covar adpc.txt --freq case-control –out 1.5_adclean.cc" But I got an error message like this: "Error: --freq accepts at most 2 parameters" and could not figure it out by myself. Any idea or help? Thank you!

*Thread Reply:* I think '-out' needs to be '--out' (without quotes, obviously).
*Thread Reply:* Thank you @Rob Kirkpatrick! Now I can see the number of case & allele observations!

Hi, I have a question about quality control and ancestry. Would you use the PCA output to identify ancestry outliers in your sample? What is the best method for identifying ancestry outliers? Thanks!
*Thread Reply:* Hi Elinor I’m not sure I understand your question. Did you run the mds part of the tutorial and look at how the sample maps onto the first 2 components of the mds? PCs are basically the same as MDS components. The tutorial plot should give you an idea of what ancestry your sample is. But remember that this plot is just the first 2 components, you can also have a look at the subsequent dimensions. But if I’ve not understood your question, just let me know.
*Thread Reply:* PCA or MDS output can be used to identify outliers. This is best done by visualizing the component 1 vs 2 plot and setting a threshold based on X standard deviations from the centroid of the ancestry group you are trying restrict to. The number of standard deviations will differ depending on your samples and the reference data you include in the analyses so you need to judge this visually. (Often it ends up being ~5 or 6 sd from the centroid).
*Thread Reply:* Thank you both - I have been a bit confused about the difference between PCA and MDS, but if they are equivalent this helps as it sounds like you would use the same approach for both. Is there a reason why you might want to use one over the other? @Sarah Medland (she/her), these are the next steps I was interested in, this is useful, thanks!
*Thread Reply:* MDS is more general. In the special case when distances (between people, objects, etc) are transformed to similarities, the MDS is mathematically equivalent to a PCA. So there’s no choosing one over the other - they’re the same if conducted on similarity (e.g., correlation) matrices
*Thread Reply:* That makes sense, thank you!

Hi @Lucía Colodro-Conde for GWAS practice a file for pca was already generated, I was wondering if it is generated with “plink --bfile adclean.cc --pca 4 --out pc” because I got values different from those in the adpc.txt… Thanks!
*Thread Reply:* Hi Kate Lucia might be able to answer more specifically, but from your code it looks like you created the PCs only on the sample of ~350 people. This will give you the structure of variation within the sample, but not on a broader ancestry scale. This is why in the practical we merged our sample with the HapMap ancestries before doing the MDS. If you haven't already tried this, perhaps go through the steps in the QC practical to generate the PCs after combining the sample with HM3 and then see if you get PCs similar to the covariate file in Lucia's GWAS practical. Katrina 🙂
*Thread Reply:* Thanks @Katrina Grasby ! This maybe a naive question, but I thought merging with HapMap was to gather the information of possible population structure in the study data (i.e. to know the ancestral structure)? Does that mean to calculate PCs, we also need to merge with a reference data? On a similar note, do we need to do the same when calculate LD? Sorry I am so confused 🤯
*Thread Reply:* You're exactly right, we did merge with HapMap in order to calculate PCs (or MDS components) that would represent ancestry.
We merged because it is unlikely that our sample captures all these different ancestries (and let's be honest no reference panel is perfectly representing all ancestries, it's just what we've got for now).
If you calculate PCs just in your sample (especially one that is this small) it's only going to capture the structure in within that sample. And maybe that is all you want or need. But if you are doing a meta-analysis of lots of cohorts that might come from various ancestries and they each only describe their population structure from within their own sample, then you won't be effectively capturing the structure across all the cohorts that are included in the final analysis.
Ideally, you would have the PCs calculated on an ancestry reference and then project your data into that space. So then your sample isn't influencing the dimension extracted. But if the sample is small, we can get away with just including it with the reference as we did in the practical.
Whether you merge or not with a reference panel to calculate PCs is going to depend on your sample, your research question, and what you are going to do with the data. As in most things with research, it comes back to thinking about what the tools (statistics) are that we are using, why we are employing them, and if they are the appropriate tools to employ.
It's great that you ran the PCs for yourself on the data we had! I'm thinking you had different values because you employed a different strategy to capture structure. Your strategy represents sample structure, where Lucia's PCs would represent a broader population structure.
*Thread Reply:* LD will be different across different ancestries. LD is about how correlated variants are. If they are in high LD then they are more likely to be inherited together (have a low rate of recombination between them). If one of them is associated with an outcome, they are both probably associated.
While LD and population structure are going to be connected. I tend to think about them for the purpose that we are measuring them. LD is looking at how correlated the variants are. PCs are describing the clustering of genetic variation in our data.
*Thread Reply:* I hope some of my long-winded waffle was helpful 🤔