Public Channels
- # anonymous-question-box
- # ask-the-admin
- # day01-intro-genomics-biometric-model
- # day02-sem-study-design-phenomics
- # day03-quality-control-gwas
- # day04-heritability-and-gcta
- # day05-meta-analysis-prs
- # day06-genomicsem
- # day07-causal-modeling-mendelian-randomization
- # day08-sequencing-introduction-to-hail
- # day09-rare-saige
- # day10-pathway-and-gene-based-analyses
- # documentation
- # f-abcd-repronim-course-videos-instructions
- # f-creation-of-videos
- # general
- # python-intro
- # random
- # session-a
- # session-b
- # technical-support
Private Channels
Direct Messages
Group Direct Messages

@Jeff Lessem (he/him) has joined the channel


@Valentin Hivert has joined the channel


@P Wainschtein has joined the channel

@Test Student has joined the channel


@Sarah Brislin (she/her) has joined the channel


@Katie Bountress has joined the channel

@Peter Tanksley has joined the channel


@Charlotte Viktorsson has joined the channel


@Matthieu de Hemptinne has joined the channel


@Sam Freis (she/her) has joined the channel


@Stephanie Zellers (she/her/hers) has joined the channel


@Zoe Schmilovich has joined the channel

@Olivia Rennie has joined the channel

@Christina Sheerin has joined the channel

@William McAuliffe has joined the channel


@Francis Vergunst (he/him) has joined the channel


@Jeff Lessem (he/him) has renamed the channel from "heritability-and-gcta" to "day04-heritability-and-gcta"
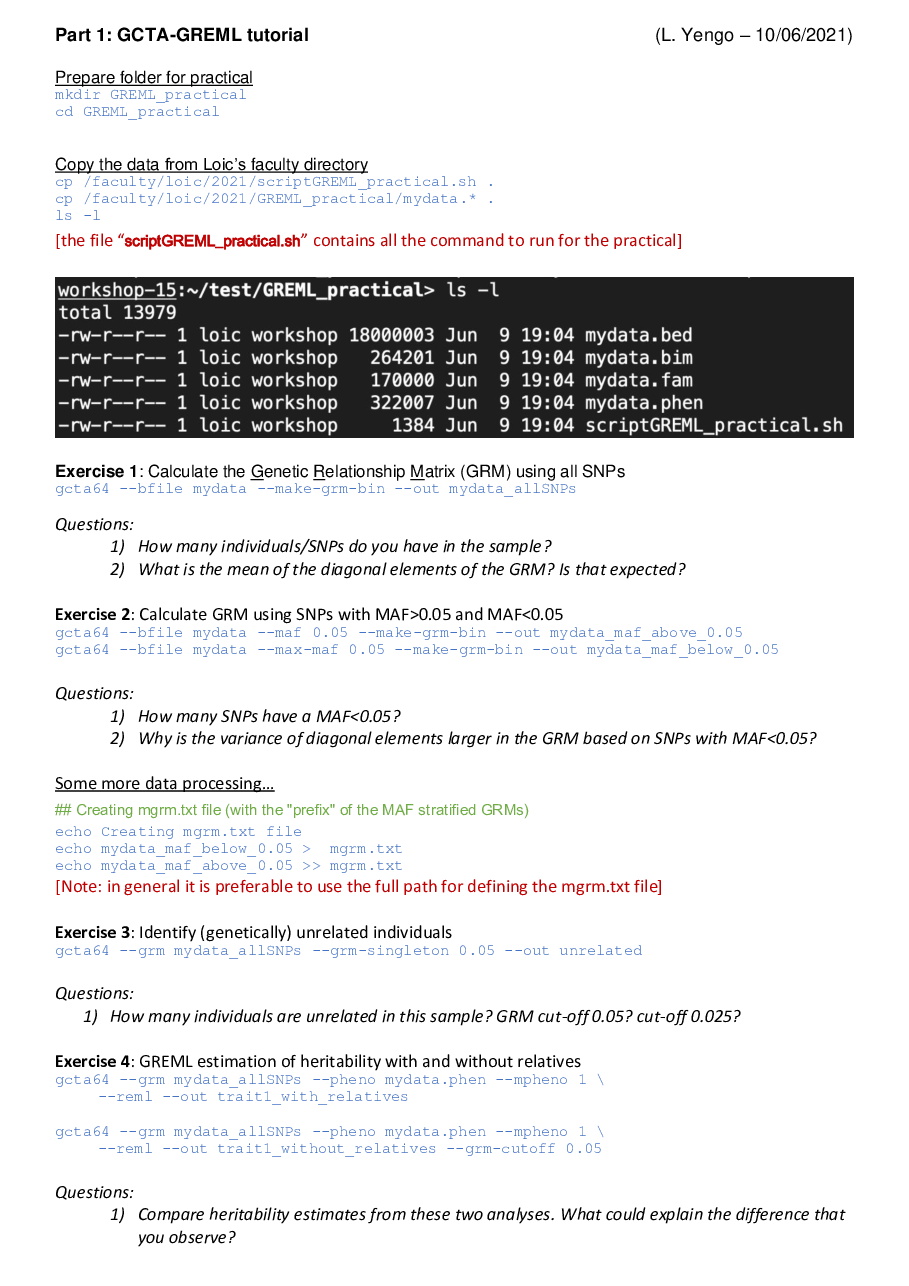
GCTA/LDSC practical can be found here: /home/loic/2021/PracticalGuidelines/Day4practical_Boulder2021.**

Correction /faculty/loic/2021/PracticalGuidelines/Day4practical_Boulder2021.**

In one video you mentioned there are various ways to measure GRM. Do these various means of measuring GRM lead to different heritability estimates? If so, how do we know which measures of heritability are most accurate?
*Thread Reply:* Hi Jason, this is great question. The answer is "Yes" how you measure genetic relatedness (GRM) affects your heritability estimates. Unfortunately, the truth depends on things that we don't know or observed such as 1) causal variants and 2) what is the relationship between SNP effects and allele frequencies. 1) and 2) are often referred to as the "genetic architecture" of the trait or the disease. So how do we know, which one is accurate? Well, methods such as the LDMS (MAF and LD stratified) provide a way to get unbiased estimates (Evans et al. 2018; Pubmed ID = 29700474).
Other than increased computational efficiency, are there any other practical reasons to choose GREML over Haseman-Elston regression for estimating heritability? And are the heritabilities largely identical using both methods?
*Thread Reply:* Another great question! HE and GREML are largely consistent in general. Differences can occur when sample size is not large enough or when the trait is not normally distributed. If possible running both can teach you something interesting about your data.

*Thread Reply:* if there is assortative mating on the trait (leading to long-range gametic disequilibrium), HE regression and GREML behave quite differently. Both are upwardly biased for realistic sample sizes (e.g., n < 100K) but GREML estimates go down as a function of n, asymptoting at h2_time0 as n -> inf whereas HE stay consistently high. See this preprint: https://www.biorxiv.org/content/10.1101/2021.03.18.436091v1.full

*Thread Reply:* Also, GREML is downwardly biased when applied to (ascertained) case-control data: https://www.pnas.org/content/111/49/E5272.short

*Thread Reply:* This followup is interesting too: https://www.cell.com/ajhg/fulltext/S0002-9297(18)30195-2

@Loic Yengo I was trying to go through the Part 2: LD score regression tutorial and I don't have read permissions for the files in LDSCREF/baselineLDv2.2/ (I wanted to look at a chromosome 1 log file for the 11-b2 question). Also, the 11-c command fails for me. I'm not sure if this is related to the file permissions?
*Thread Reply:* Yeah, I broke it, but I'm fixing it now
*Thread Reply:* I just realised 11-c had /data/ in the path which I removed and it's working now. I should have paid more attention!
*Thread Reply:* That is what we want, the students should be reading the files from /data, but writing to their own directory
*Thread Reply:* The files a very large, so we need to avoid having all of the students copy them locally. I did put in some symlinks, so it might work with the default paths
*Thread Reply:* That makes sense now. It now works with the /data path. Thank you.
*Thread Reply:* Thanks Jeff for fixing this and Sorry for the inconvenience, Penelope
One more question. How would I determine if the number of cases and/or the number of SNPs in my dataset are appropriate for doing a GREML (OR HE) analysis? In other words, how do I know if I have enough cases and/or SNPs to get accurate estimates of heritability?
*Thread Reply:* For a sample size, you can try a power calculator: https://shiny.cnsgenomics.com/gctaPower/
*Thread Reply:* or maybe this one: https://cnsgenomics.com/software/gcta/#GREMLpowercalculator
@channel: here's tomorrow's practical. It has been updated since yesterday.

Hi, I have a question @Loic Yengo, regarding to the videos. I don't really understand the importance of estimating h2 SNPs. For example, we can know h2 from twin and family studies, and we can also know the variance explained from a polygenic risk, then why should we calculate h2 SNPs, if we can directly know for example the genetic variance of a trait from PRSs? - has this variance explained from PRSs something in common with h2 SNPs? - Actually we know from recent studies that the % of variance explained from PRSs that use genetic variants irrespective of genome-wide significance can be similar to h2 estimates from twin and family studies. Thanks ;)
*Thread Reply:* Hi Guiomar! Thanks for the great question. h2SNP gives you an upper bound for the prediction accuracy of your PRS. In other words, h2SNP > R2PRS. So why would you like to know that upepr bound? Well, it could be useful to evaluate how much more information contained in the observed SNPs you may still be missing to improve your prediction. Also, estimating h2_SNP could be a first hint on a trait heritability when there is no twin study around. Hope these two examples speak to you. Cheers, L
*Thread Reply:* great thanks! your response is really helpful
*Thread Reply:* I agree with both of Loic’s reasons. Let me give a couple more. First, one can look at the relative importance of different annotations using GREML or LDSC (e.g., variants in genes expressed in CNS, variants that are conserved, etc.). That’s impossible to do with twin/family studies and under-powered in PRS studies. Second, one can investigate genetic correlations between traits that are impossible to look at in twin/family data, either because the traits haven’t been measured in them, the data isn’t available to you (twin data still tends to be proprietary whereas this isn’t so for much GWAS data), or the rg is between traits that are mutually exclusive or too rare to co-occur within families
*Thread Reply:* thanks Matthew for your points

@Loic Yengo You mention in video 3 that certain siblings will be more genetically related than others due to recombination — could you expand on that a bit please? I have never quite got my head around how recombination works!
*Thread Reply:* Hi Laura, sure. The degree of DNA sharing between sibling is ~0.5. However, if we directly measure the proportion of DNA segments that are identical by descent between siblings, we see that this proportion actually varies between say ~0.35 and ~0.65 (check Fig.1 in this paper: https://journals.plos.org/plosgenetics/article?id=10.1371/journal.pgen.0020041). The reason is that during meiosis DNA from each parent is recombined in different ways before being passed on to each offspring. Therefore, recombination is the phenomenon responsible for within family variation in IBD. Hope this clarifies, a little bit.
@Loic Yengo if you get different heritability estimates when doing HE regression in GCTA for HE-CP and HE-SD how would you interpret that and what would be the next steps (if any) to follow up?
*Thread Reply:* Hi Nathan, good question. I'm not sure how much degree of difference do you talk about. The estimates may not be identical but they should be largely similar by design. Do you have a particular example to share?
*Thread Reply:* No I was just curious what you would do in case there was a difference (or if it's possible to have a meaningful difference)
*Thread Reply: They should be broadly similar but not necessarily. A couple of reasons off the top of my head they can differ: (1) HE typically doesn’t use the diagonals of the GRM whereas GREML does. For common variants, this doesn’t matter much because there are only n diagonals but (n*(n-1))/2 off diagonals, so MUCH more information in the off-diagonals. However, as you move to rare variants and/or when there is much ancestry structure in your sample, this can be counter-balanced by the variance of the diagonals getting much higher (we’re talking 1000s to 100k fold higher!) than the variance of the off-diagonals. This is a problem with the current way that GCTA figures diagonals which I don’t think is well appreciated yet. (2) As I noted in a response above, if there is assortative mating on the trait (leading to long-range gametic disequilibrium), HE regression and GREML behave quite differently. Both are upwardly biased for realistic sample sizes (e.g., n < 100K) but GREML estimates go down as a function of n, asymptoting at h2_time0 as n -> inf whereas HE stay consistently high. See this preprint: https://www.biorxiv.org/content/10.1101/2021.03.18.436091v1.full

@Loic Yengo Great videos! It was very cool to see using distantly related people to get maximally unbiased heritability estimates. Does this approach get to test the equal environments assumption? Has the EEA survived such tests?
*Thread Reply:* I’ll jump in and hopefully Loic does as well. It’s a good question. By equal env. assumption (EEA), I take you to mean the equal twin env. assumption (that rgenv for MZs = rgenv for DZs). GREML/HE don’t directly test that assumption, but do by extension. h2 estimates from GREML/HE are expected to be lower to the degree that causal variants aren’t tagged by SNPs used to build the GRM (in unrelated samples), and should therefore be a lower bound of the twin/family h2. Thus, observations of h2 in GREML/HE suggest that at least some of the h2 in trait X cannot be explained by violations in the EEA. As we move to using sequence data (and figure out the proper ways to perform GREML/HE in sequence data, which isn’t trivial!), h2 from GREML/HE should approach the full narrow-sense h2, and at that point we’ll get a clearer picture of the degree to which twin/family estimates have been biased this whole time. I strongly suspect they will end up being a bit biased depending on the trait, but little of this bias will be due to violations of EEA
*Thread Reply:* Thank you! You unpacked this very well. Does limiting participants to distantly related improve the bias further?

How can we order the mug?
*Thread Reply:* I’m a Loic fan. I’d buy one!

I have a quite specific LDSC question as we sometimes see (significant) negative heritability results when using part. heritability and we struggle to find a proper explanation. So currently we rather think that these results might be biased by a small proportion of SNPs in some of our custom annotations. Also, --h2-cts seems to use a one sided test compared to the standard --h2 flag. Does this have a distinct reason?
*Thread Reply:* I’m curious to hear people’s thoughts on this one too
*Thread Reply:* Hi! • regarding significant negative heritability, I am not sure I have a good explanation here... I think you broke the model with some annotation deeply depleted for heritability, which will have a negative regression coefficient and thus a negative heritability. • regarding h2-cts, yes it is dong a one test comparison as it s specifically looking for cell-type enriched in h2, and thus having a regression coeff >0. I think the -h2 flag only outputs z scores and not P value, so that it let you decide if you want to do a 1 or 2 sided test Does this help?

For [question-2 in exercise-2] higher variance of diagonal elements for GRM based on MAF < . 05 Could the difference in frequency itself have effect on this variance other than the effect of the number of variants used?

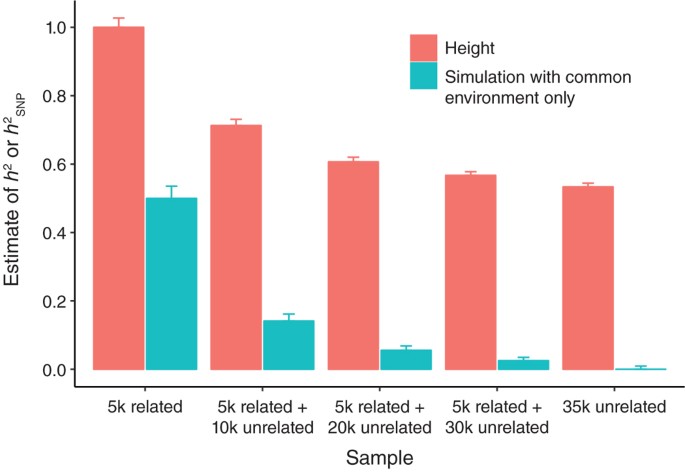
@Loic Yengo In exercise 4, we are estimating heritability without relatives and with relatives. Inflated heritability observed in samples with relatives is not due to shared genetic factors?. Thanks
@Loic Yengo What are the three sets of SNPs used for LDSC analysis? Why do we use three sets of SNPs and what is their relevance in LDSC analysis?. Thanks
*Thread Reply:* Great question, Priyadarshini! Steven redefined the three sets in the first "Background" section of the practical. In brief, one set is the set of SNPS directly used to run the regression. Here, we have ~1M of them. The over sets refer to how LD scores were calculated. To calculate the LD score of each of these ~1M SNPs you need to sum the r^2 with the neighbouring SNPs. Depending on how many neibouring SNPs you use you can end up with say ~10M (including ~6M with a MAF>5%). So why? We don't need to many SNPs to get the regression right so ~1M is enough. However, to capture the right amount of variation we may need to calculate LD scores relative to more dense sequenced SNPs (e.g., 10M). @Steven Gazal, you want to add something here?
*Thread Reply:* Nothing to add! It is important to keep in mind that while you are doing a regression on "only" 1M SNPs, you are modeling the effects of 10M SNPs through the LD scores computed on a reference panel with 10M sequenced SNPs, and you are reporting effects on common reference SNPs (~6M). This is different from GCTA where you are estimating h2 tagged by all the SNPs that are in your data.

Hi! About the LDSC part of the tutorial: why is the heritability estimate when using stratified LDSC higher compared to when we're not stratifying the LDSC analysis? And why should we trust the stratified LDSC estimate more?
*Thread Reply:* I hope @Steven Gazal weights in as well or @Loic Yengo but ill try my best at an awnser. If we run basic (unstratified) LD score regression we are basically assuming a model where the true effect SNPs are distributed across the entire genome almost uniformly and only LD determines how much effect wd'll expec tto observe at any SNPS (more LD and you tag more causal SNPs). However in reality the true effect SNPs can be expect to be found more in some parts on the genome (in or near genes for example) then in others. the annotation used are based on prior ideas about where in the genome we might expect causal SNPs to be found, those ideas are reasonable so the baseline model is likely a better description of where in the genome true causal SNPs are and can be expected to provide a slightly better h2 estimate.. Now which model is better requires additional evaluation (esp if you compared competing sets of annotation in your stratified LD score analysis) and I dont know whether there is a best practice way to compare models (internally we have used cross validation to test which among various stratified LDSC models fits best)
*Thread Reply:* dont trust my answer fully untill you hear from the others!
*Thread Reply:* You're good! It is known that 1) per-SNP heritability strongly varies according to MAF and LD (SNPs with high MAF and/or low LD explain more variance); 2) these MAF- and LD-architectures bias heritability estimates. The second model includes MAF and LD annotations that help to correct for this bias.
*Thread Reply:* Yes, it helps! One more follow-up question: you describe that we should not use LDSC heritability estimates, but that heritability estimates of the baseline-LD model can be used with extreme caution. Do you recommend to not use those stratified LDSC heritability estimates at all or would it be informative to report both heritability estimates from GCTA and S-LDSC?

When would you use LDSR over GREML-SNP?
*Thread Reply:* If you have the raw data in hand and computational issues (in terms of RAM and computational time) are not an issue, then I’d go with GREML. But - that’s not the world we live in. The advantage of LDSR over GREML (and why it’s become more used) is that one can use LDSR without having the raw data (just having the sumstats) and that it can be done MUCH more computationally cheaply than GREML

*Thread Reply:* This paper, https://www.nature.com/articles/ng.3941 , contains some discussion that's relevant to your question.

Thanks for the great lectures on heritability and GCTA, the topics were broken down in a really clear way! Are there any power calculations to estimate genetic correlations in LDSC regression? GCTA-GREML has a great power calculator, but as LDSC regression requires more power, is there another tool that can be used specifically for LDSC regression?
*Thread Reply:* In relation to this, are there any power calculations for Genomic SEM, and would this be different when using LDSC vs HDL in Genomic SEM? I'm aware that a LDSC SNP-heritability Z score less than 5 is an indicator that the GWAS summary statistics might not be powered enough for gSEM analyses.. could you use this threshold for a power calculation? @Michel Nivard
*Thread Reply:* Ill let the LDSC ppl speak for their lack of power calculator 😉 but as far as GenomicSEM is concerned its really hard to make a general power calculator when people can fit a great variety of models. Power for what? power to distinguish one latent variable model from another? power to detect a SNP acts on the latent factor, or power to test whether we can reject the premiss that a SNP acts via a latent factor (instead influencing traits directly). THe the underlying power in LDSC will probably depend heavily on the gneeitc architecture (how many causal SNPs, how are causal SNPs spread across the genome). WRt LDSC vs HDL I think HDL should win out IF you have a proper reference LD set (thew authors state HDL is sensitive to missingSNPS in the GWAS that are in the ref). So if you for example use a medium sized (30-50k) Swedish, Japanese or Norwegian dataset for your thesis or a multi year period HDL could offer power gains, and it could be worth it to take the time to create an HDL LD reference.
*Thread Reply:* alll this is to say this is a really great question, and in any multi year project/paper question it's probably worth it todo some power simulations, be sure to reach out if you need guidance those.
*Thread Reply:* Excellent, thanks so much Michel for the detailed answer. Looking forward to today's workshop!
Today's Practical has been (slightly) updated. Please check here: /faculty/loic/2021/PracticalGuidelines/Day4practicalBoulder2021v4.docx or /faculty/loic/2021/PracticalGuidelines/Day4practicalBoulder2021v4.pdf or https://docs.google.com/document/d/1OZilaO1GhV2vz5iAm4wl-TyiV2LxezBzhecBXxpHmKc/edit?usp=sharing
I'm curious about building ldsc from source on my computer here at home. What is the minimal set of dependencies necessary to do so? Just the conda package manager, and the dependencies listed in environment.yml ?
*Thread Reply:* Or to put it another way, is a full anaconda installation really necessary to build ldsc?

If you have not seen it before, do also check out LDHub- a user friendly way to implement LD score regression for calculation of SNP heritability and also genetic correlations http://ldsc.broadinstitute.org/ 🙂

Hi all, just a worksheet layout suggestion for this practical for next year, from the absolute beginners in my group: Practical Part 1 was really clear and easy to follow, even for beginners. Practical Part 2 was pitched a bit too advanced for beginners, because we do not yet have the skills to write our own code to answer the questions. It would be really helpful if the worksheet could provide the code required in the main body of the text. I see now (afterwards) that the code is provided in the answer section at the end, but none of us found this during the tutorial. There is so much new content to plough through each day that we're not getting time to read through the worksheets before the tutorial starts. Thank you!

*Thread Reply:* Hi Kristen, I think Loic said in the presentation of the practical that the answers were at the end of the document... and to check them if required at any time... Maybe this information could have been reiterated, I know there are many documents and things to coordinate!
*Thread Reply:* Thanks Lucia - we didn't appreciate that code would be included with the answers. Kristen
*Thread Reply:* Thanks Kristen for the valuable feedback. We will take that into account for the following sessions and next year workshop. Glad you found Part 1 didactic 😃

Hi, @Steven Gazal, I am new in the field and I am getting to know LDSC. I was wondering why the threshold for the intercept is 1.
*Thread Reply:* Hi Lucia! The idea between LDSC is that when you regress chi-square statistics on LD scores, the slope is proportional to heritability, and the intercept tells you how stratification impacts your GWAS results. Regarding your question, a good way to visualize that is to consider a null GWAS with no heritability (slope=0) and no stratification; in that case the mean chi-square is 1, so we expect the intercept to be 1. Does this make sense?
*Thread Reply:* Hi Steven. Yes, it does make sense. Thank you!