flowchart LR
  A(common cause) --> D(Estimand correlation)
  B(BMI -> Dep) --> D
  C(Dep -> BMI) --> D

  D --> E[estimator]
  E --> H[Estimate correlation]
  F[sampling] --> H[Estimate correlation]
  G[measurement] --> H[Estimate correlation]
Causes of Covariation
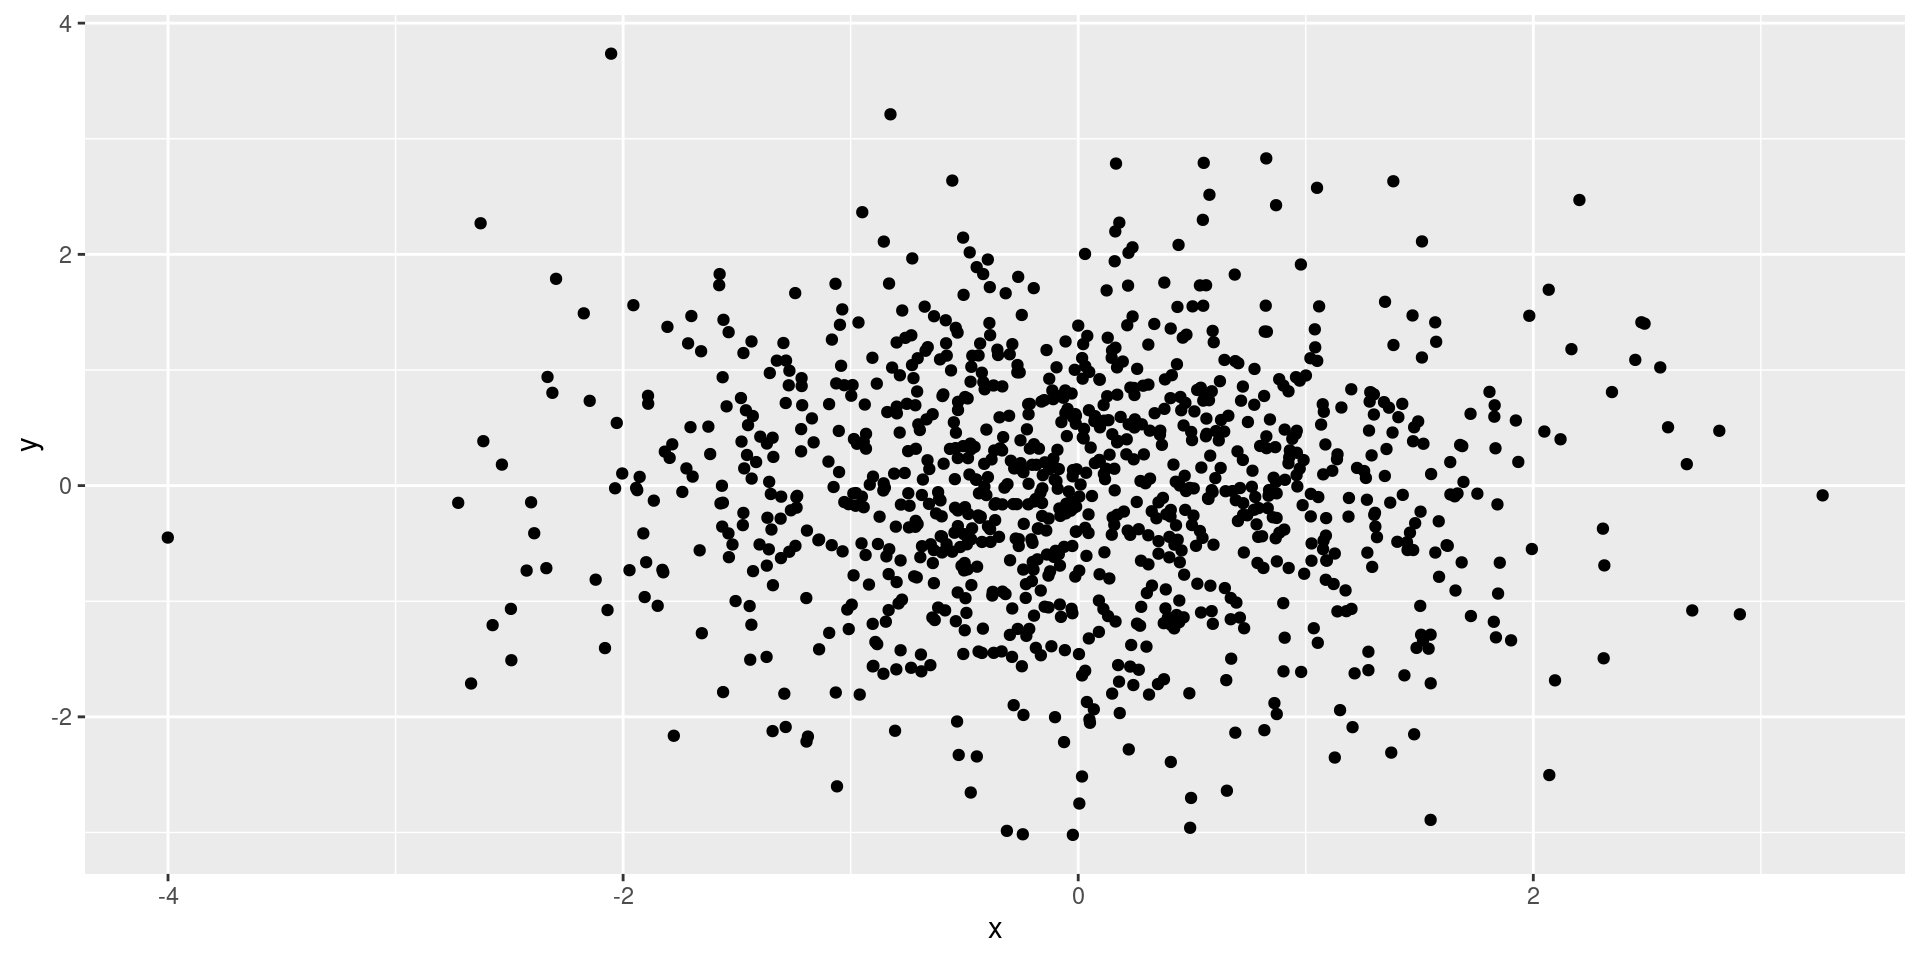
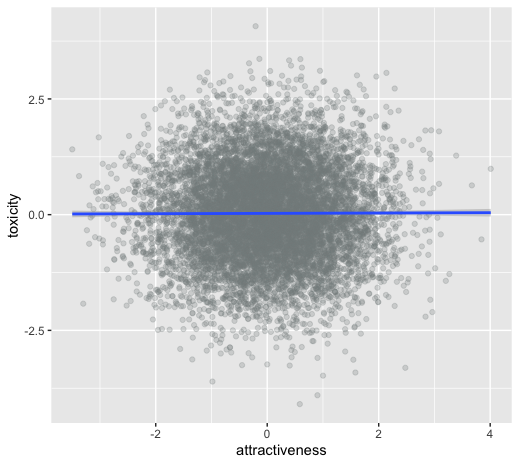
Uncorrelated
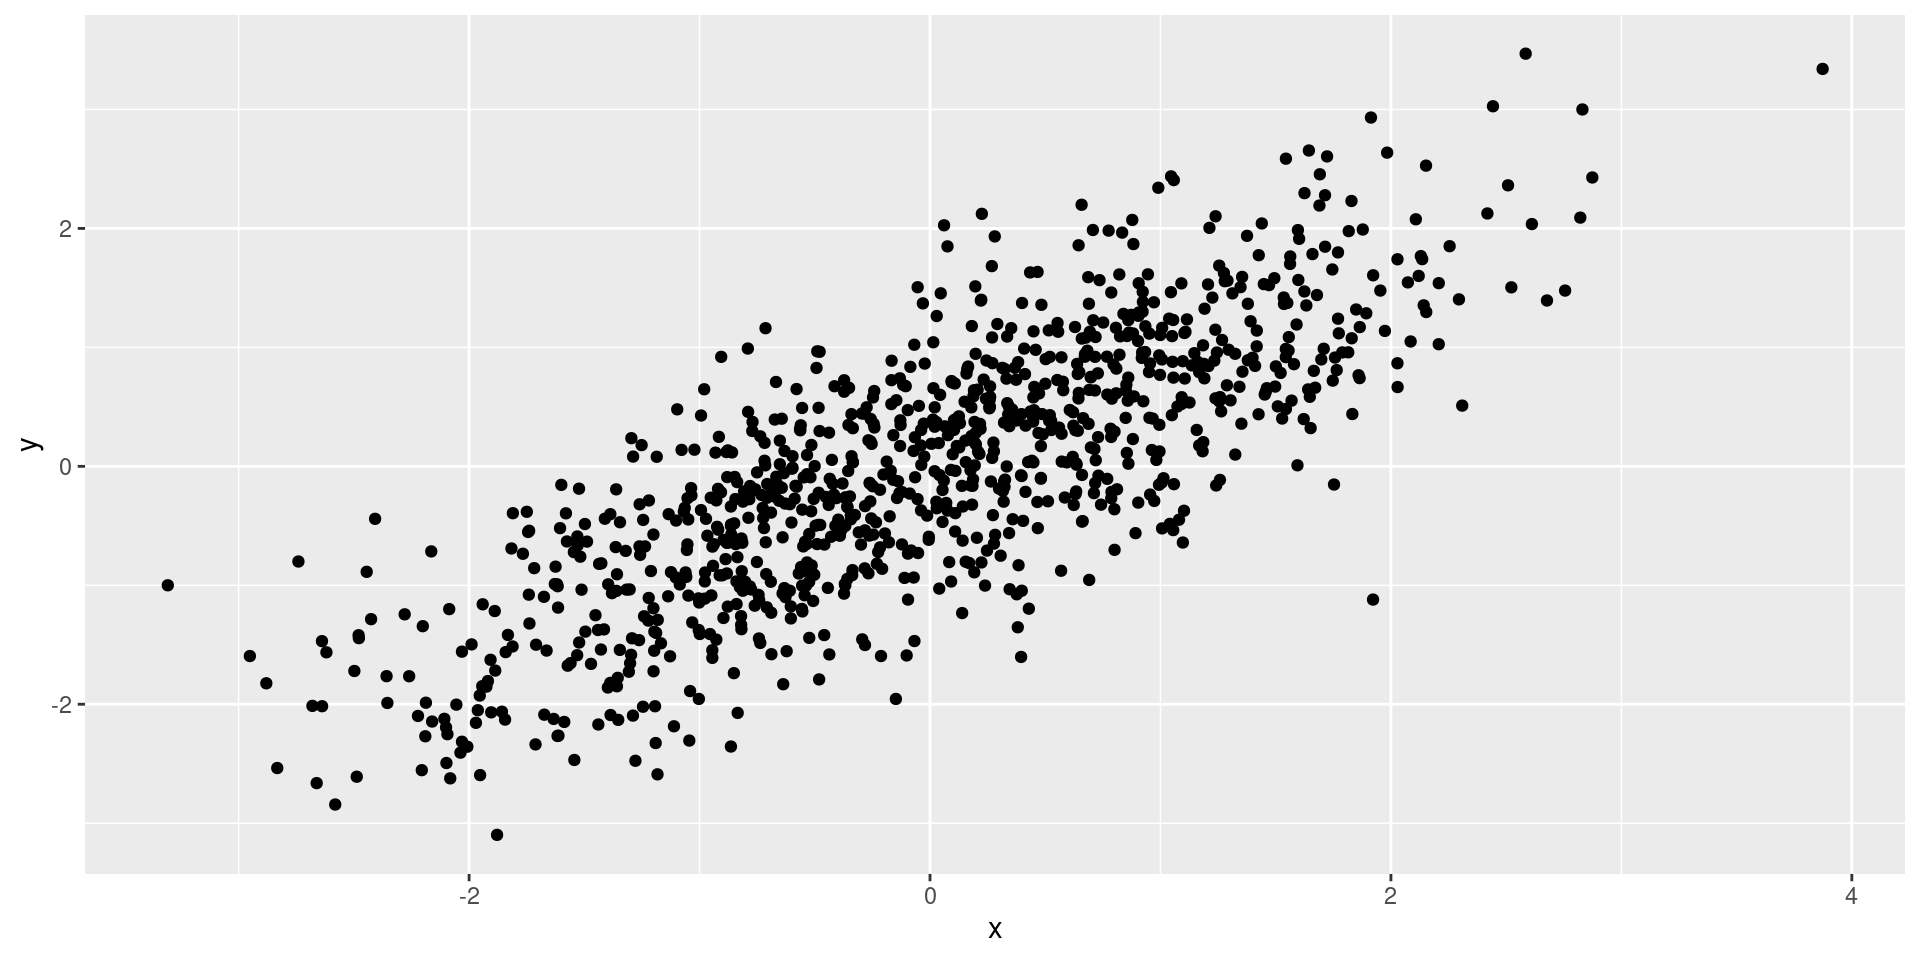
Correlated
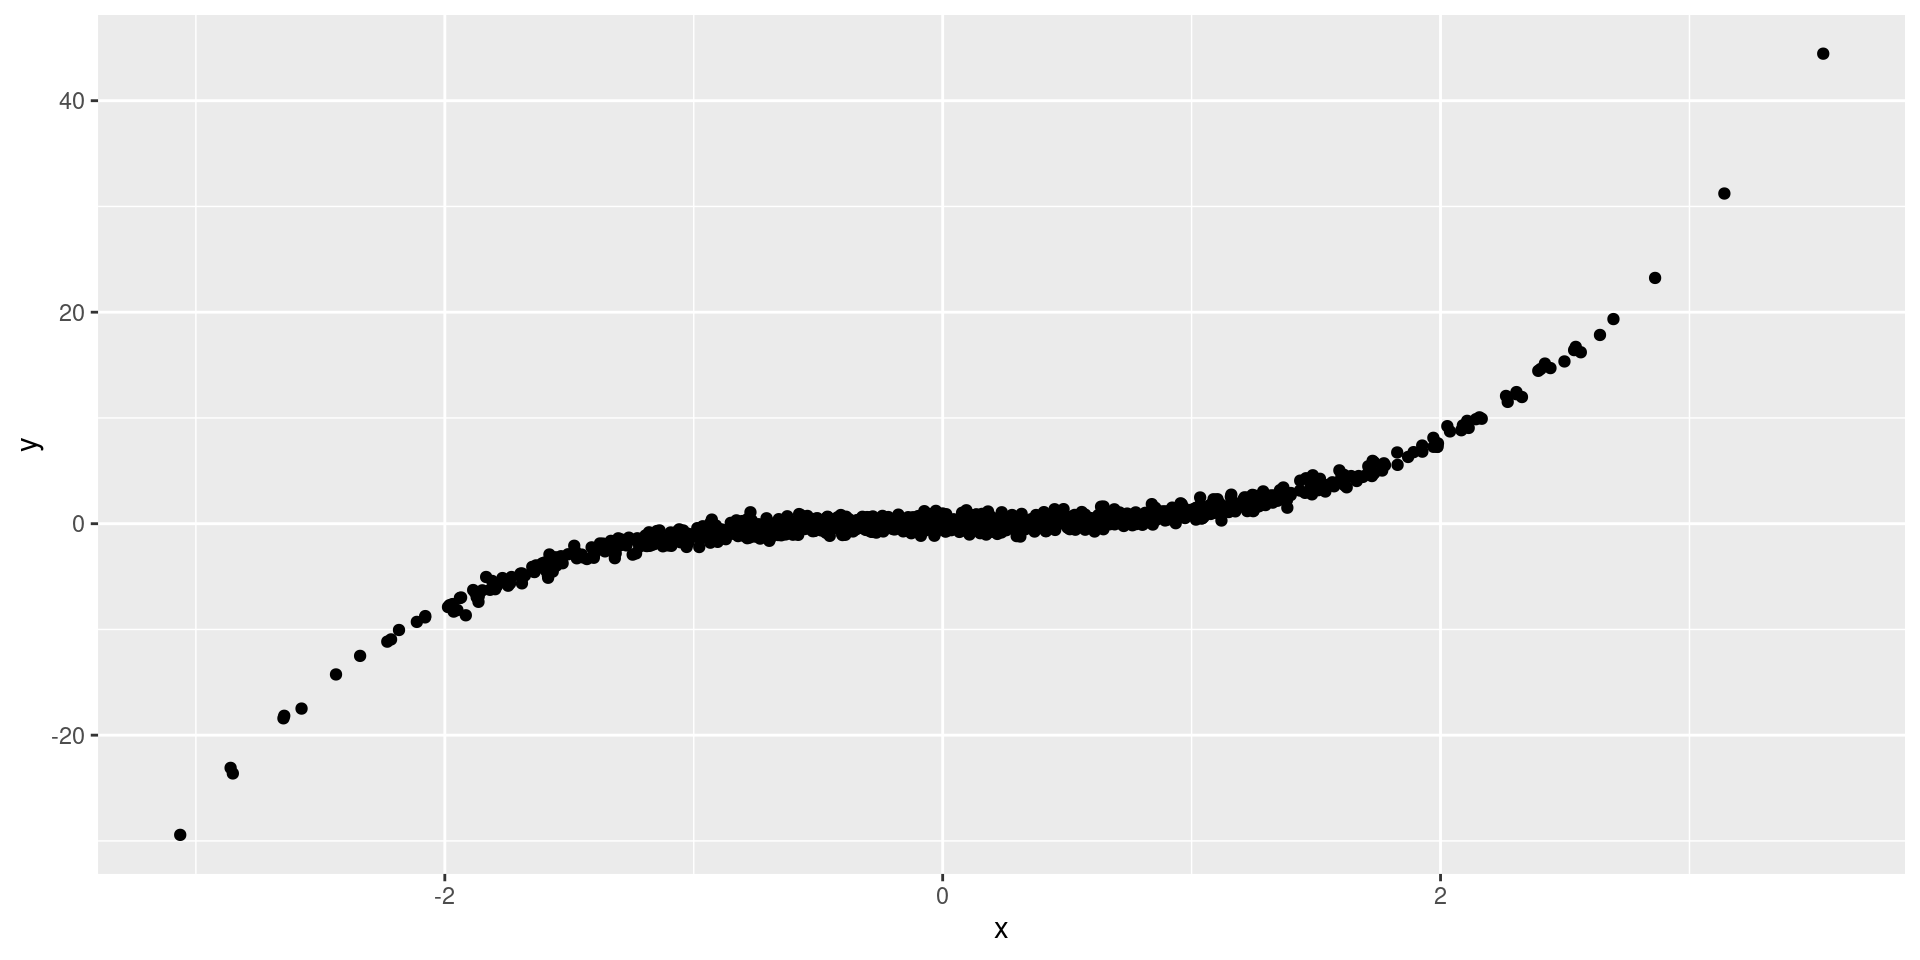
Functionally related, but is it correlated?
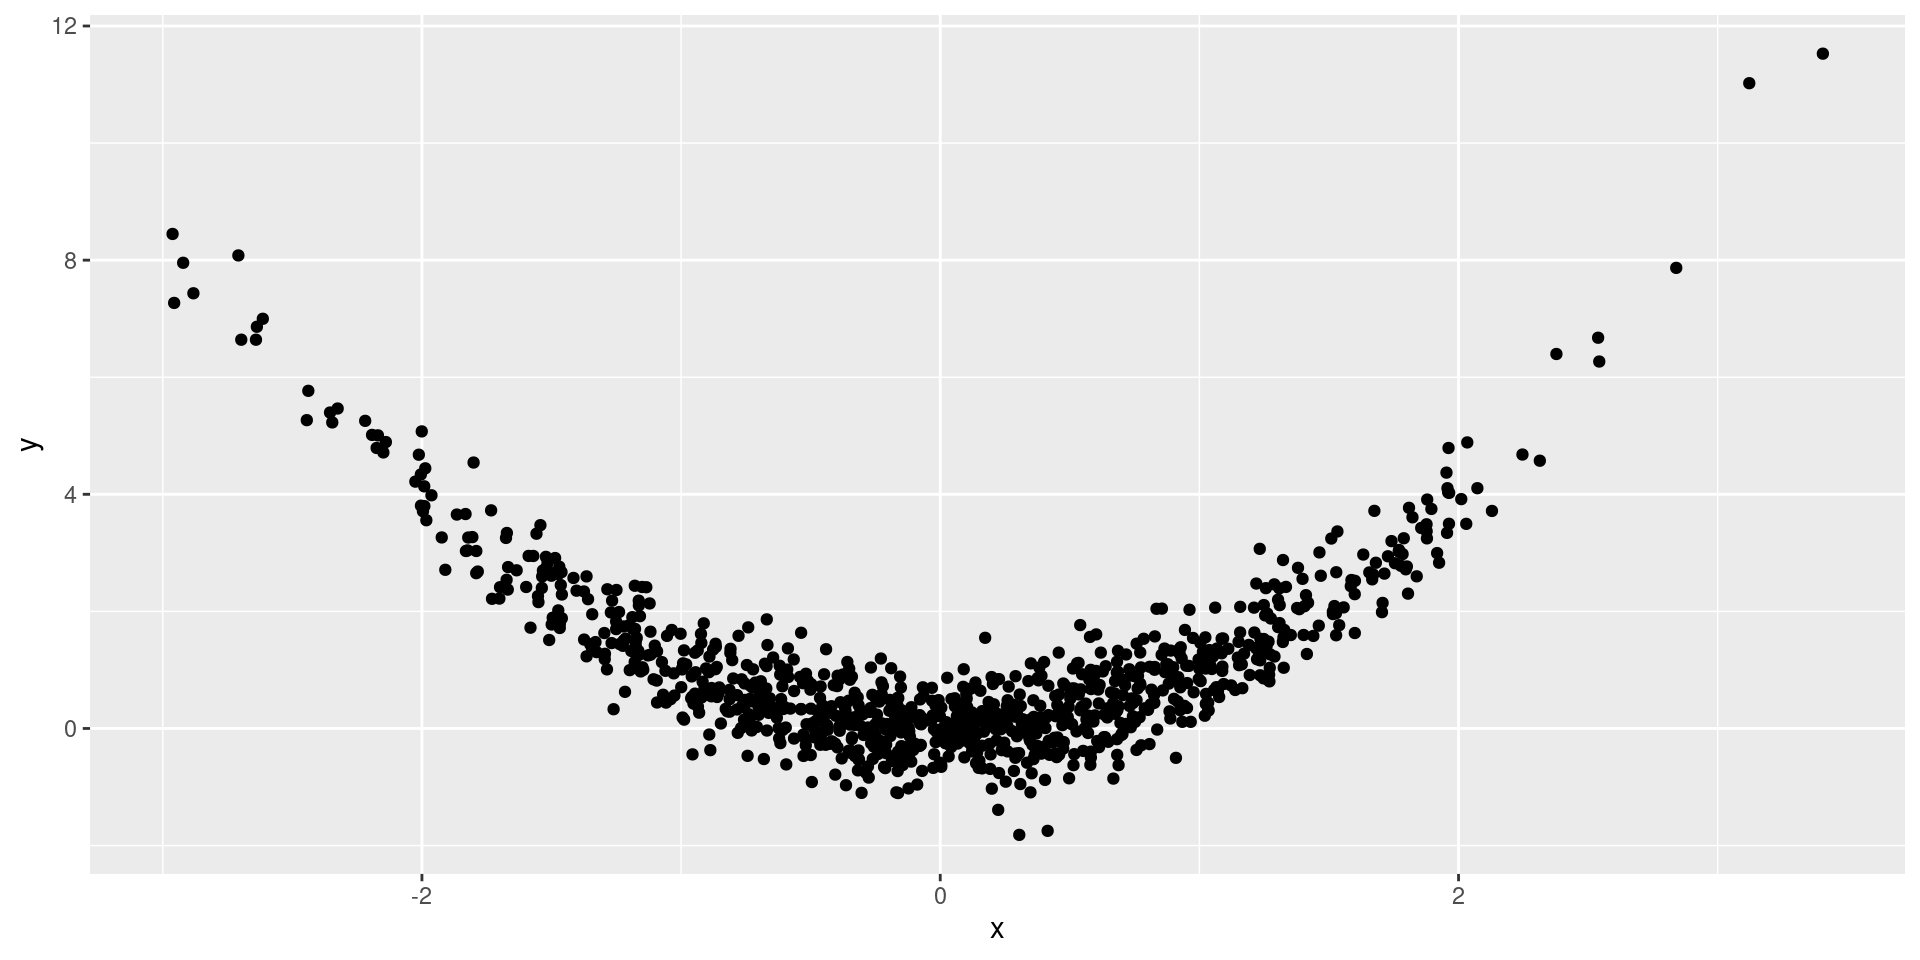
Functionally related, but is it correlated?
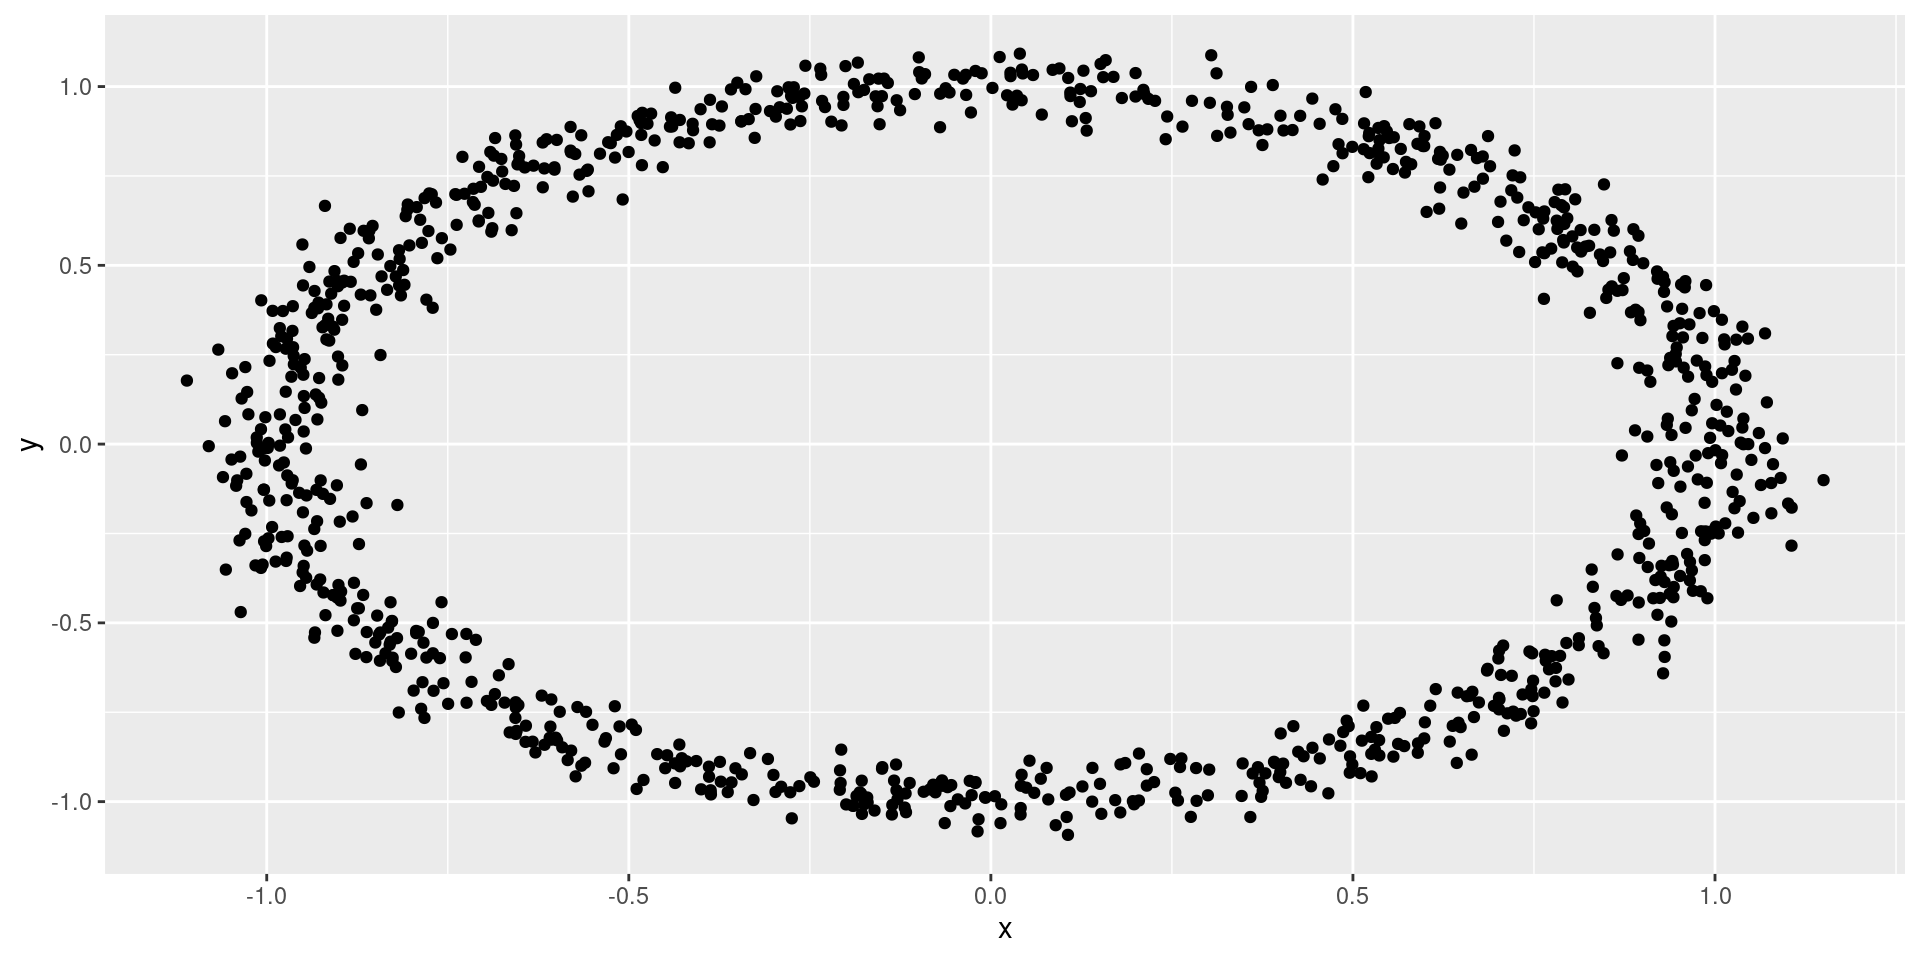
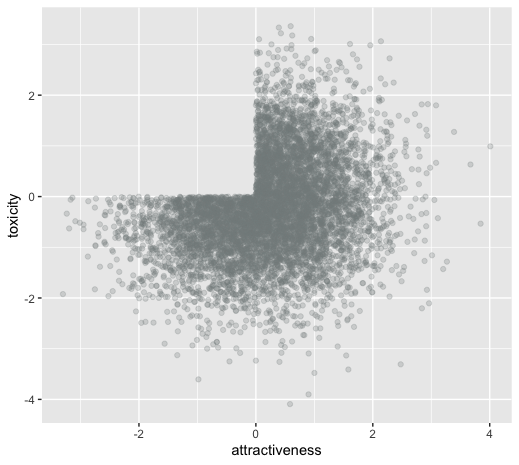
Dependent, likely uncorrelated…
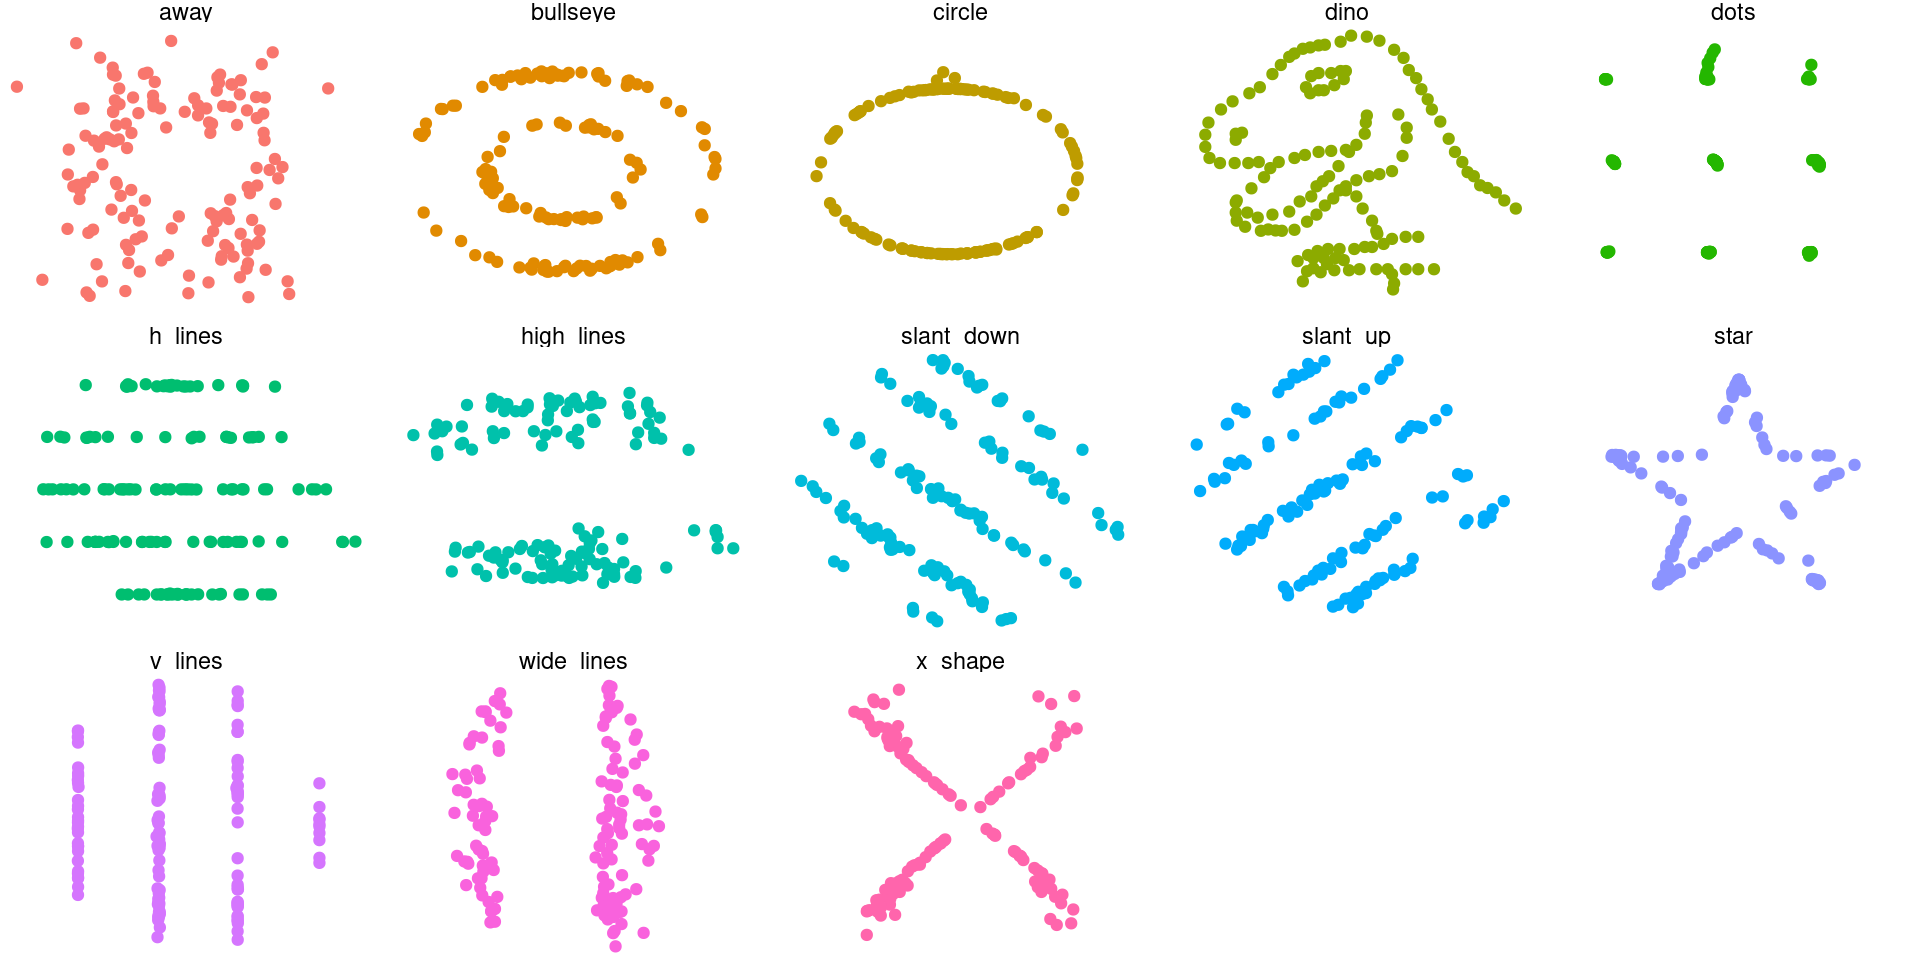
scatterplots go brrr
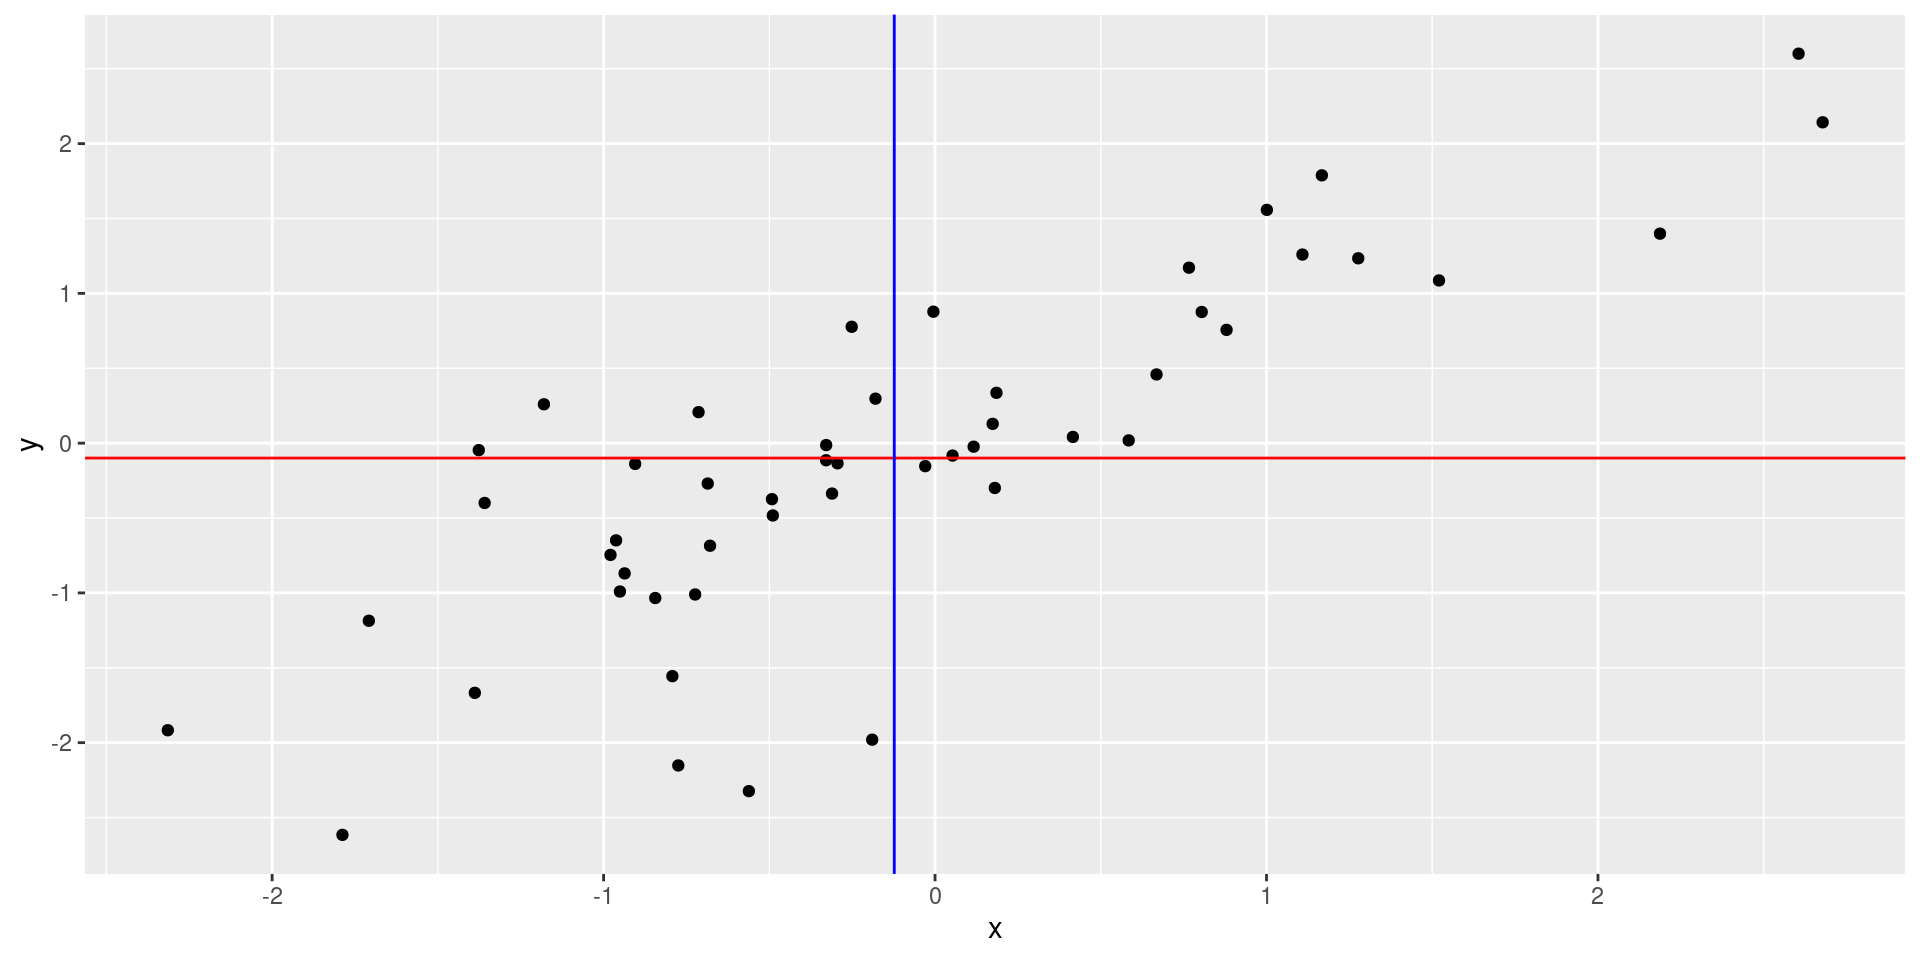
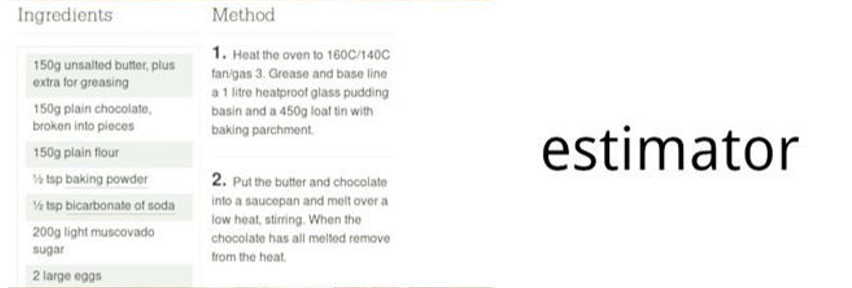
A common estimator of covariance
\[cov_{x,y} = \sum_{i = 1}^{n}{\frac{(x_i-\color{blue}{\bar{x}})*(y_i-\color{red}{\bar{y}})}{N-1}}\]
What is it that you want to know?
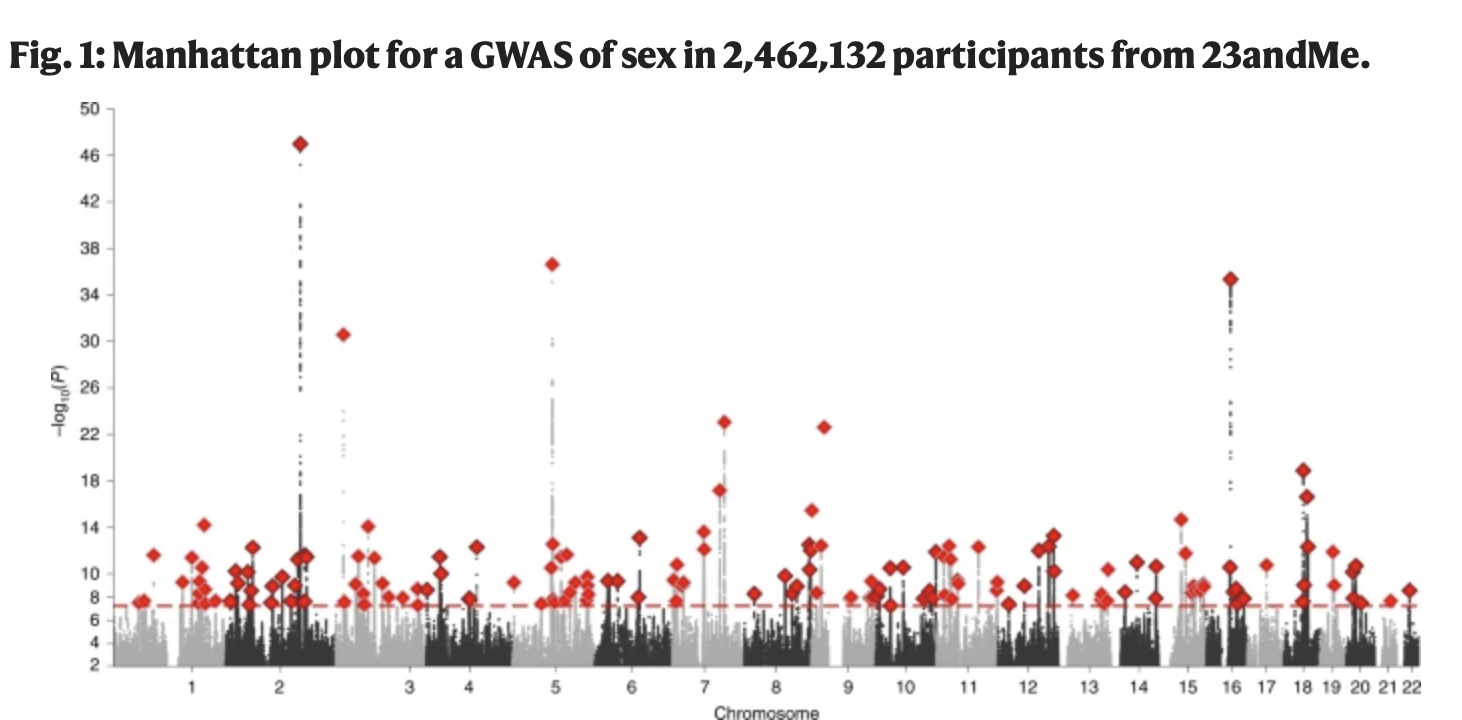
“are risk for depression and BMI genetically correlated?”
How will you go and find out?
“we will apply LD score regression to two sets of GWAS summary data form two different consortia, that studied BMI and MDD”
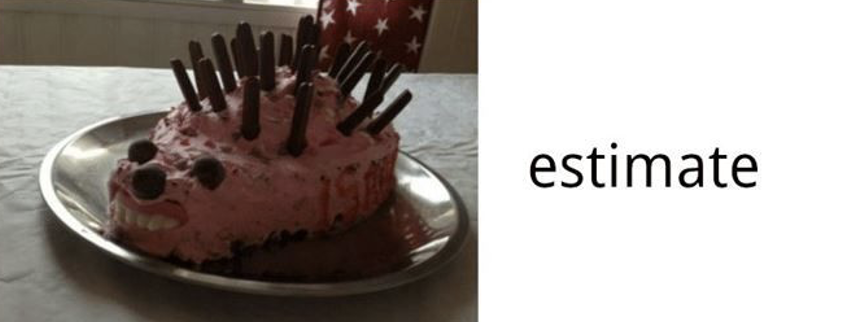
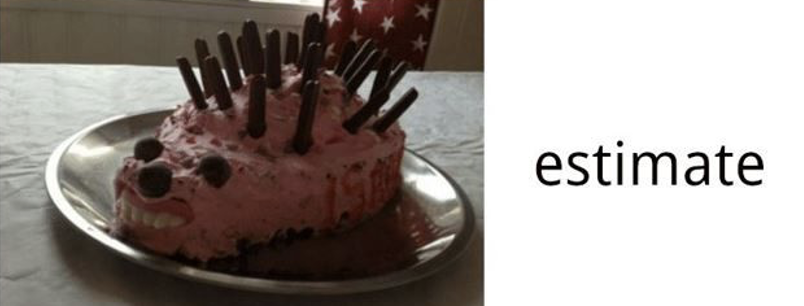
What did you find?
“The estimate of the genetic correlation between the PGC MDD, and GIANT BMI GWASs, Using LD score regression is 0.09”
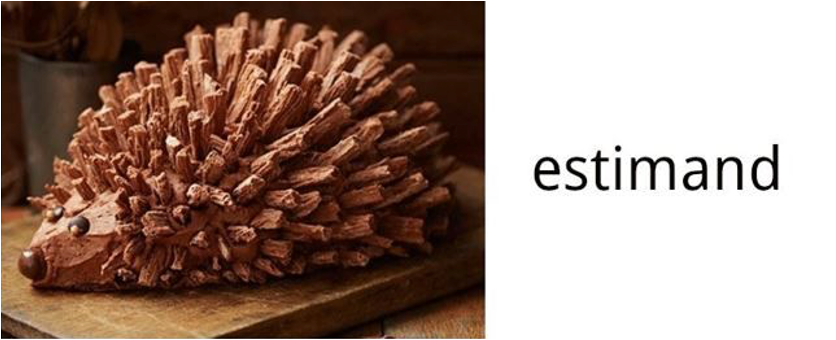
correlation, estimands and estimate
- We almost always want to know about processes that move the estimand
- The diagram below, depends on your estimand!
causation, estimands and estimate
- If we change the estimand, or estimator the diagram shifts!
- Estimand: “The causal effect of BMI on Depression”
Collider bias: dating example
Collider bias: dating example
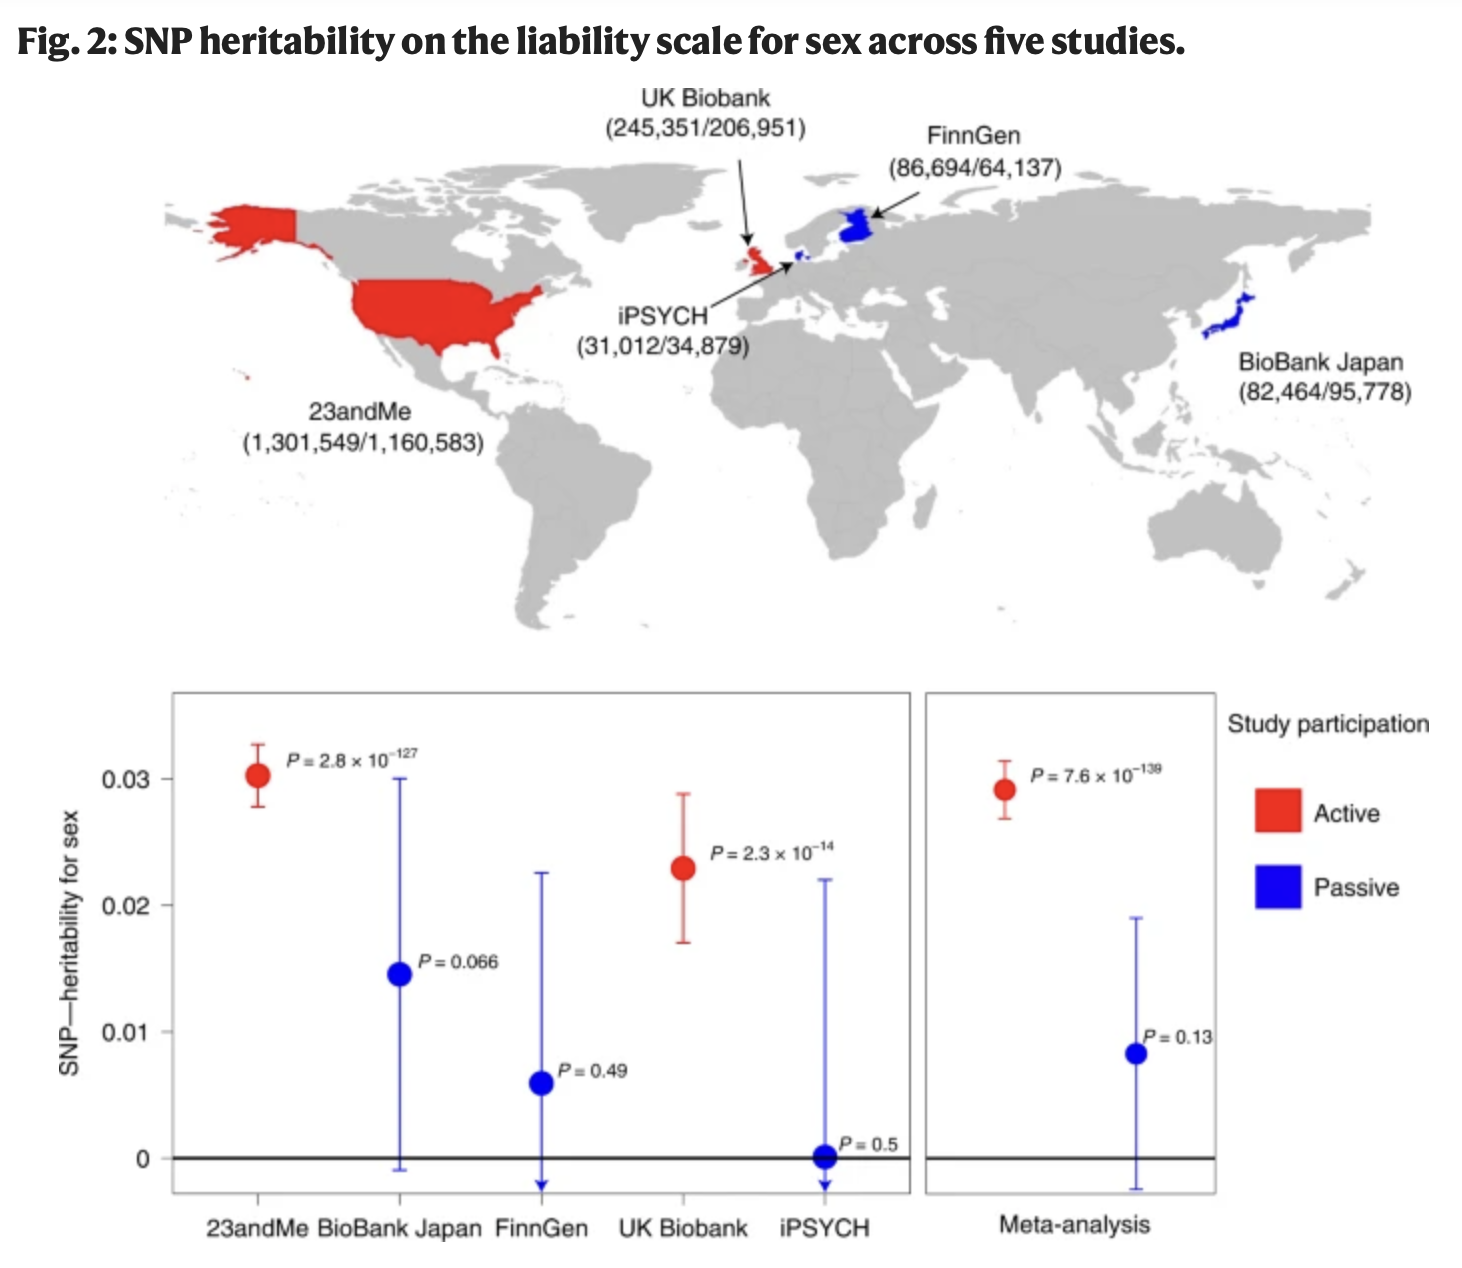
How common is this? Should I care?
How common is this? Should I care?