SNP heritability and ascertainment
Logistics
cp -r /faculty/michel/2023/practical/ .learning goals
Be able to asses the limits of heritability in the context of out field
familiarity with SNP heritability and the logic behind LD score regression
appreciate the influence of sampling and measurement (asertainment) on our estimates.
What is heritability?
Briefly discussed Monday in What Genetics has taught us about life (Nick) and Biometrical Model/Genome and its secrets (Ben)
Briefly discussed in Family-based association on Tuesday
What is heritability?
- Expressed as a proportion of the genetic variance in a trait to the total variance of a trait.
- This is the narrow sense heritability, enough for today
Key nuances related too h2
Depends on population (Loic on Tuesday and Ben on Monday)
Doesn’t always imply biology!
Heritability is dependent on population, time, age
The strongest GWAS hit for lung cancer is in a Nicotine receptor gene sub unit.
Would the nicotine receptor gene sub unit have been a lungcancer hit if we would have had a UKB in the year 1300?
Will it be in the year 2100 if smoking rates are near 0?
Heritability doesn’t always imply biology
If Lung cancer would have been 100% caused by smoking (it isn’t), would it be heritable?
Would this heritability imply biology of lung cancer?
How sure are you your trait of interest has substantial heritability that is orthogonal to heritable environmental causes?
narrow sense heritability definition in GWAS context
the standardized phenotype (\(y\)) is a sum of the squared effects of \(n\) standardized (mean = 0, sd = 1) genotypes (\(g\)) and the environment \(e\):
\[ y = \sum_{n=1}^{n} b_{n}*g_{n} + e\]
narrow sense heritability definition
The additive genetic effect then equals:
\[\sigma^2_a = \sum_{n=1}^{n} b^2_{n}\]
\[h^2 = \sigma^2_a / (\sigma^2_a + \sigma^2_e)\]
What is SNP heritability?
Briefly discussed Monday in What Genetics has taught us about life
The proportion of genetic variance measured or tagged by SNPs measured on genotyping chips.
poorly covers rare and structural (CNVs etc) genetic variation.
What is SNP heritability?
\[y = \sum_{n=1}^{n} b_{n}*g_{n} + e\]
\[\sigma^2_a = \sum_{n=1}^{n} ? * b^2_{n}\]
Where \(?\) = is an unknown loss of precision because we will not always measure, or tag by LD the true causal variants.
What is SNP heritability?
- What do we know about the loss of precision?
- We tag rare(er) variants less well
- We tag CNVs and other structural variants less well
- Its not as simple as rare vs common tough
estimating SNP heritability: LD Score regression
In GWAS we estimate a form of this regression:
\(trait = \hat{b}_{0} + \hat{b}_{snp} * SNP + error\)
This gives us an estimate of the true effect of differences in allele count at this SNP: \(b_{snp}\), the difference between the estimate and the true value is denoted with the little hat.
Can you come up with systematic reasons \(b_{snp}\) and \(\hat{b_{snp}}\) differ?
beta, and beta hat…
if our SNP has “LD buddies” snp2 and snp3…
\(\hat{b}_{snp} = b_{snp} + LD*b_{snp2} + LD*b_{snp3} + bias + \epsilon\)
What can we learn from this?
if \(b_{snp}\) is 0, \(\hat{b}_{snp}\) need not be
\(\hat{b}_{snp} = 0 + LD*b_{snp2} + LD*b_{snp3} + bias + \epsilon\)
If LD is greater, or more SNPs are in LD, \(\hat{b}_{snp}\) can increase the absolute \(b_{snp}\)
relating these equations to SNP heritability
\(\hat{b}_{snp}\) contains 3 pieces:
- \(b_{snp} + r^2_{12}*b_{snp2} + r^2_{23}*b_{snp3}\)
- \(bias\) (drift/stratification uncorrelated to LD)
- \(\epsilon\) (goes down with GWAS N)
The variance in \(\hat{b}_{snp}\) goes up with LD.
estimating SNP heritability: LD Score regression
for convenience LDSC works with Z-stats not beta’s
\(Z = \hat{b}_{snp} / se_{b}\)
And we summarize the LD a SNP has with its neighbors as:
\(LDscore_j = \sum_{k=1}^{k}r^2_{kj}\)
\(E[Z^2_j] = 1 + N*a + \frac{N*h^2_{snp}}{M} *LDscore_j\)
some intuitons
Why \(E[Z^2_j]\) and not \(E[Z_j]\)?
Why is the 1 here: \(E[Z^2_j] = 1\)?
mean(Z^2) = 1!
Lets confirm the LDscore relations empirically
Get schizophrenia GWAS, and the east-west (latitude) locatiom of your home in UKB
\(E[Z^2_j] = 1 + N*a + \frac{N*h^2_{snp}}{M} *LDscore_j\)
What is your expectation of \(a\) or the intercept (postrat/bias) for each?
What is your expectation of \(\frac{N*h^2_{snp}}{M}\) or the slope (heritabilty) for each?
Lets confirm the LDscore relations empirically
cp -r /faculty/michel/2023/practical/
Practical failsave
library(ggplot2)
scz2.sumstats <- read.delim("scz2.sumstats.gz")
ldscore <- read.delim("1.l2.ldscore")
eastwest.sumstats <- read.delim("eastwest.sumstats.bgz")
# Make Z^2 from Z
scz2.sumstats$Z2 <- scz2.sumstats$Z^2
eastwest.sumstats$Z2 <- eastwest.sumstats$Z^2
mean(scz2.sumstats$Z2)
mean(eastwest.sumstats$Z2)
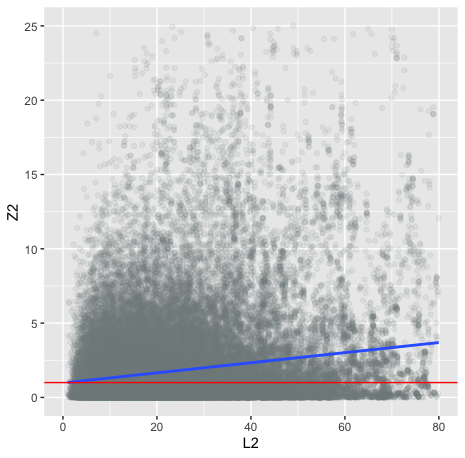
# heritable trait sanity check:
scz.merged <- merge(ldscore,scz2.sumstats,by="SNP")
ggplot(scz.merged, aes(x=L2, y=Z2)) +
geom_point(alpha = 1/10,col="azure4") +
xlim(0,80) +
ylim(0,25) +
geom_smooth(method='lm') +
geom_hline(yintercept = 1,col="red")
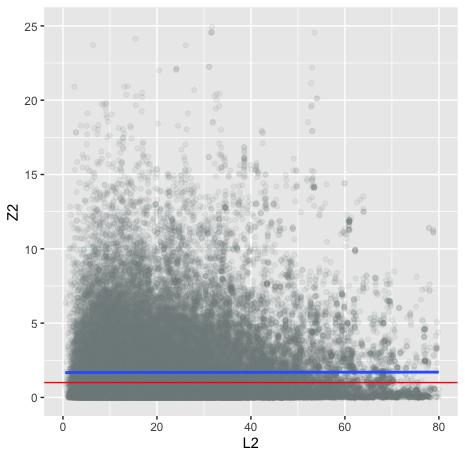
# pop-strat sanity check
eastwest.merged <- merge(ldscore,eastwest.sumstats,by="SNP")
ggplot(eastwest.merged, aes(x=L2, y=Z2)) +
geom_point(alpha = 1/10,col="azure4") +
xlim(0,80) +
ylim(0,25) +
geom_smooth(method='lm') +
geom_hline(yintercept = 1,col="red")Practical failsave Schizophrenia
Practical failsave east-west
Ascertainment
Ascertainment
- The people in your study aren’t always representative of the population (sampling)
- The measurement of your trait is not the same as your trait (measurement)
- These aspects of a study can follow from design, or unintentionally
Ascertainment by design
Over-sample cases in a schizophrenia GWAS (because its rare)
Target a study at a specific populations with specific health needs
You will need to adjust for this when computing \(h^2_{snp}\)!!
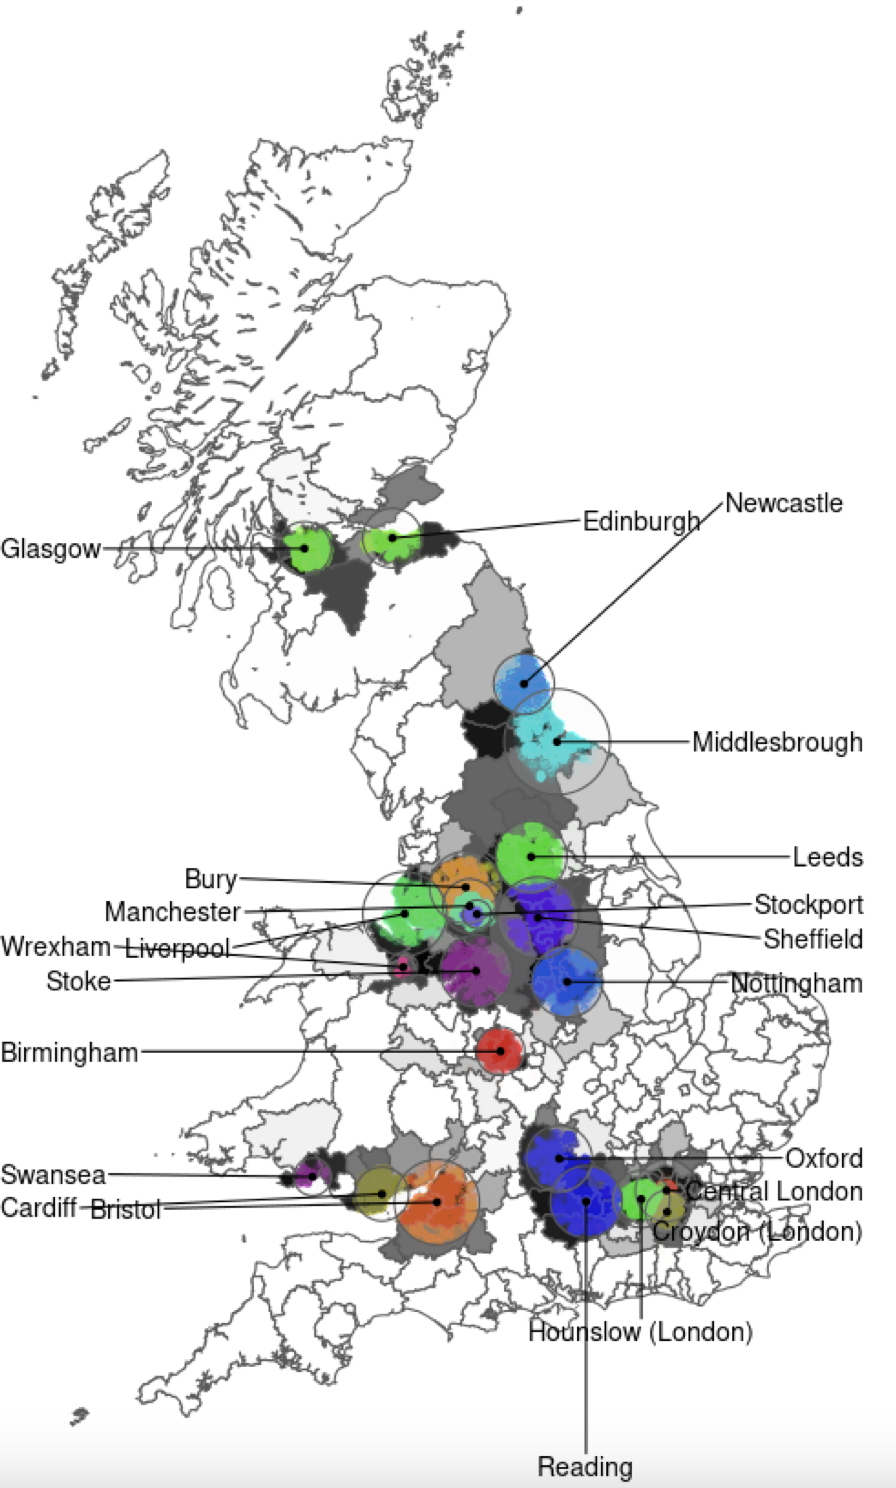
unintentional ascertainment (sampling)
low SES participants might not have the time to spare for a day long lab study at a location that has poor access via public transport
Elderly people might only respond to email if their 1. online 2. able too
level of institutional trust may influence people’s willinges to consent
unintentional ascertainment (sampling)
Why would I care?
It will bias all(!!) statistical estimates and inference
There is a long causal chain between populaiton and sample
unintentional ascertainment (sampling): Collider bias
if: outcome1 -> ascertainment & outcome2 -> ascertainment
in the ascertained sample outcome1 and outcome2 will correlate!
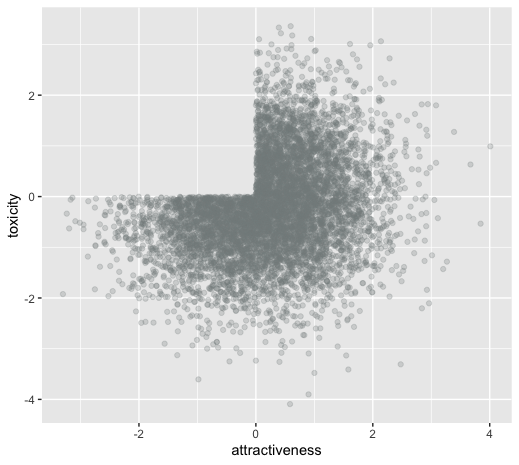
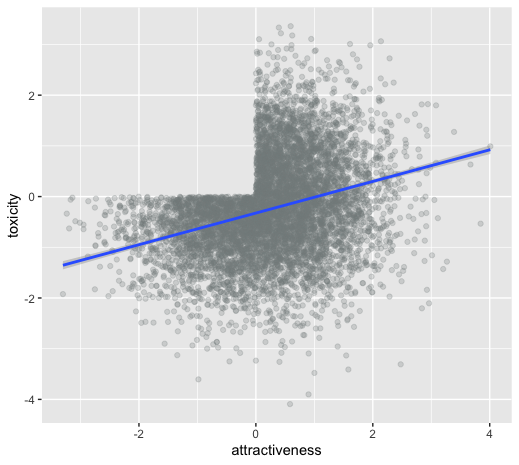
unintentional ascertainment (sampling): dating example
Why do people feel their more attractive partners where also more toxic?
Maybe its true?
Or is it collider bias?
unintentional ascertainment (sampling): dating example
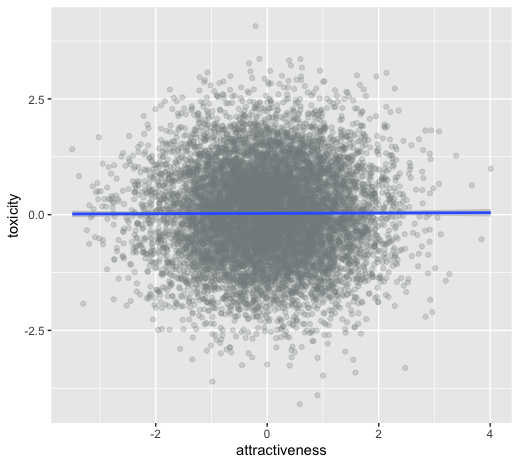
unintentional ascertainment (sampling): dating example
unintentional ascertainment (sampling): dating example
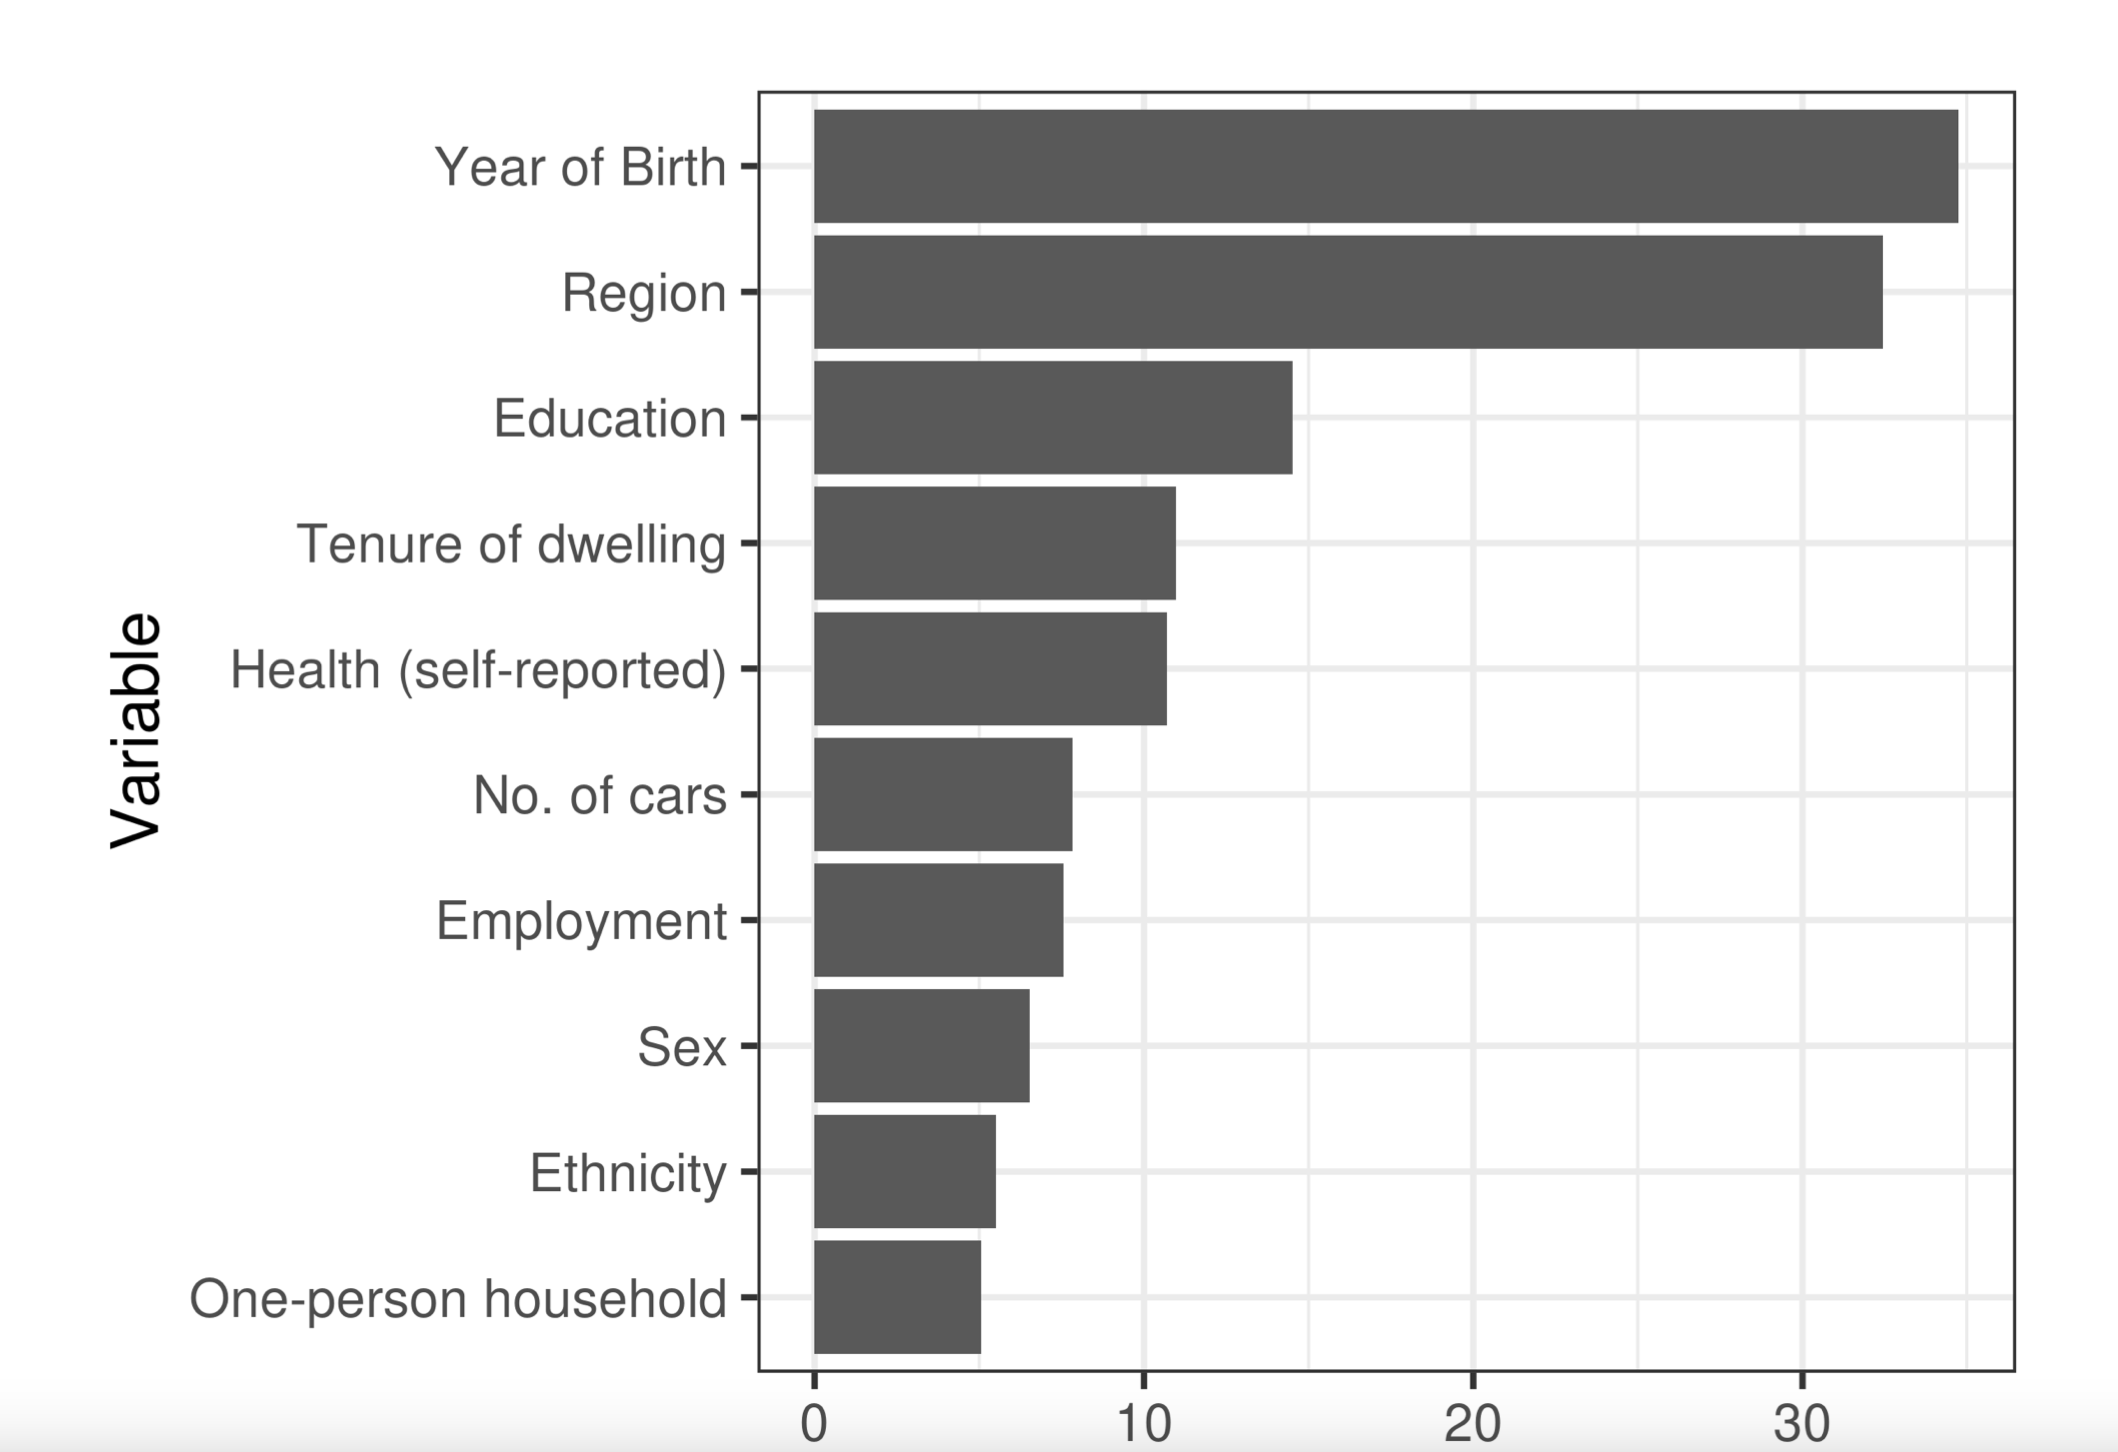
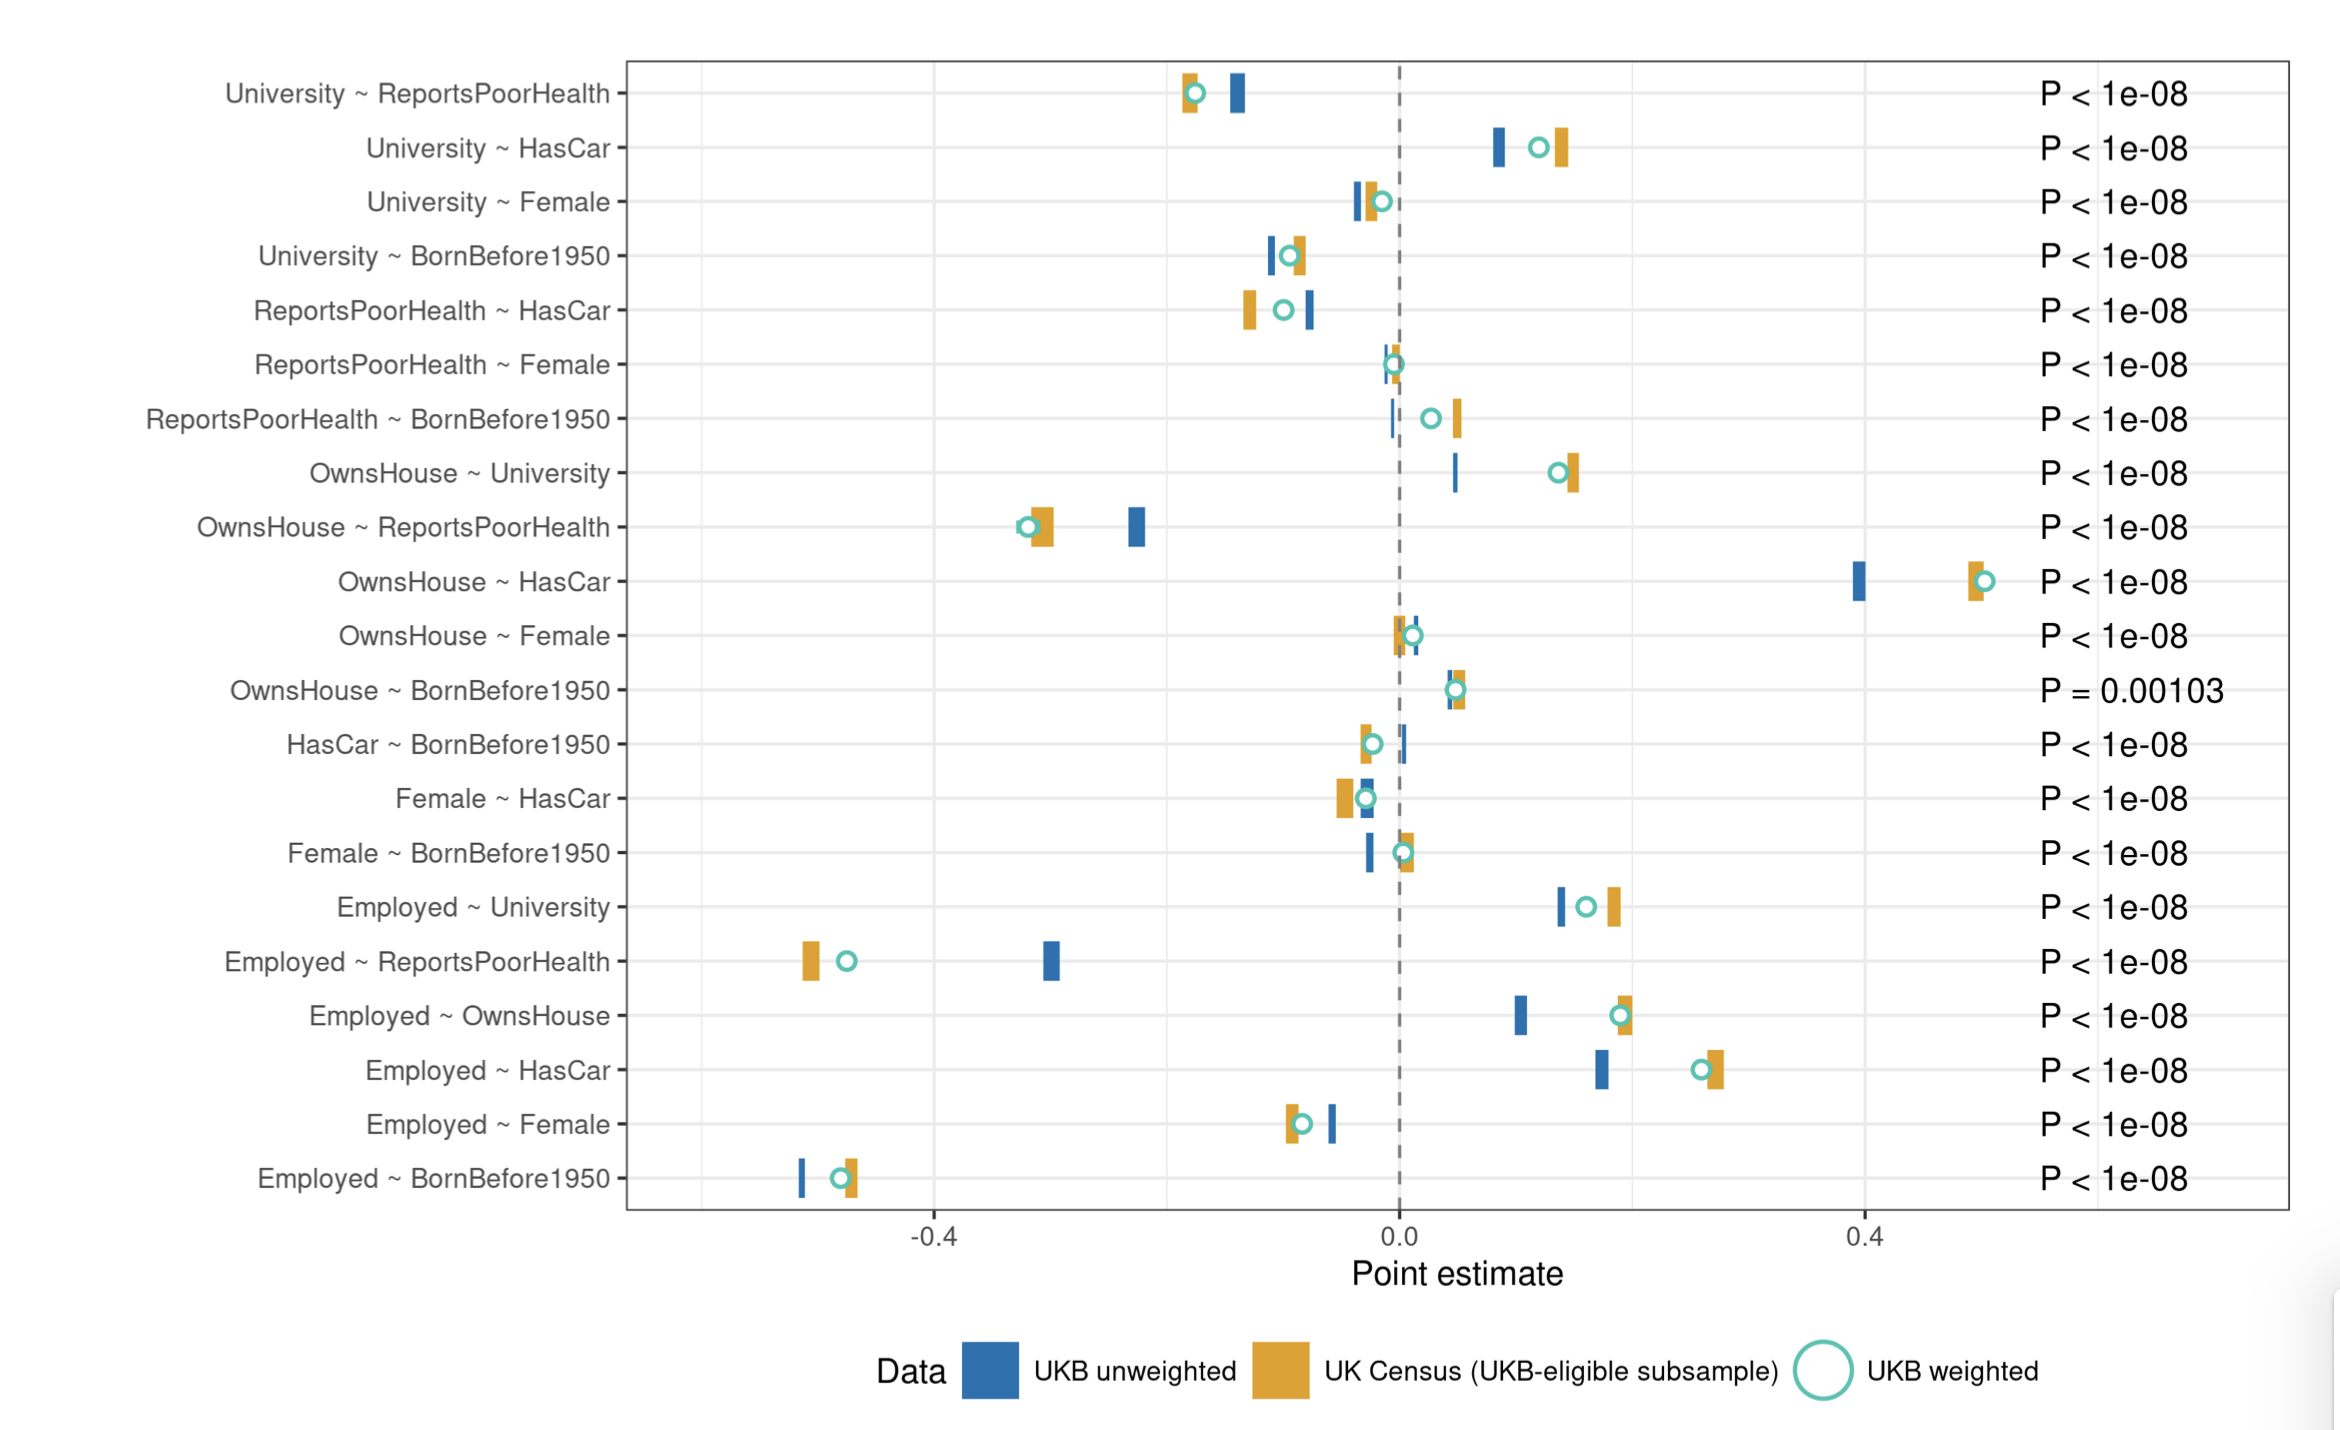
unintentional ascertainment (sampling): Genetics example
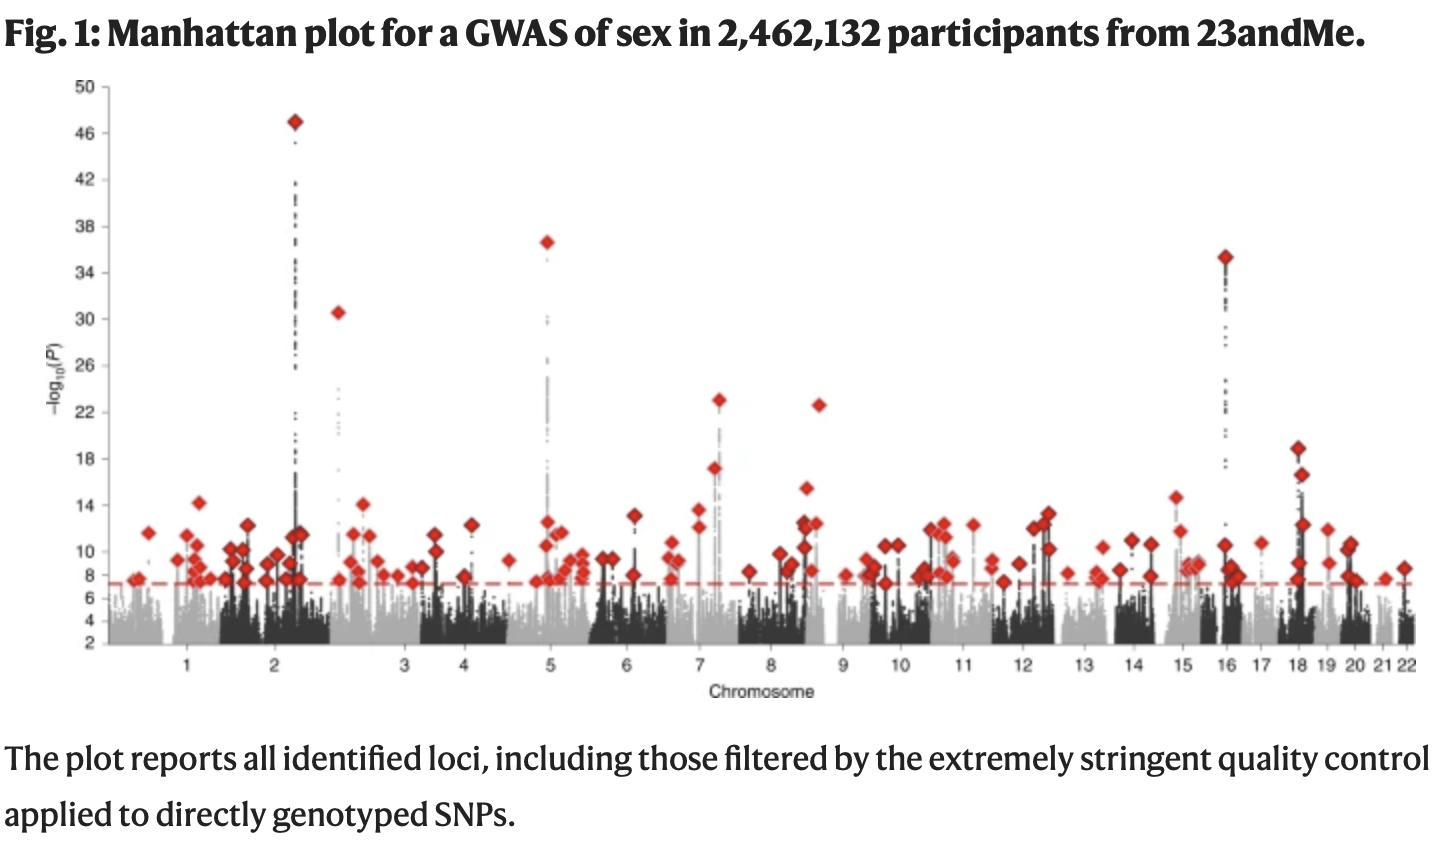
unintentional ascertainment (sampling): Genetics example
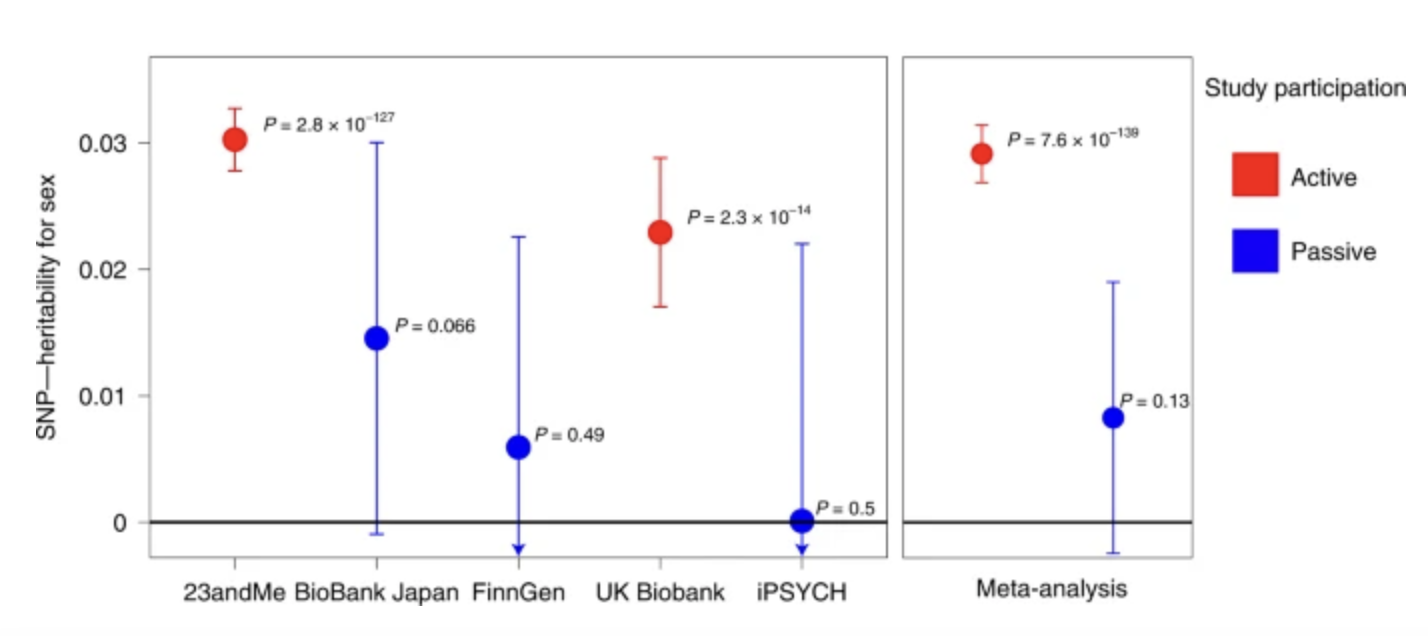
unintentional ascertainment (sampling): Genetics example
unintentional ascertainment (sampling): Genetics example
unintentional ascertainment (sampling): Genetics example
unintentional ascertainment (sampling): Solutions
unintentional ascertainment (sampling): Solutions
unintentional ascertainment (sampling): Solutions
Measurement: Does it matter?
There is a long causal chain between a trait “ideal” and the phenotype in your file
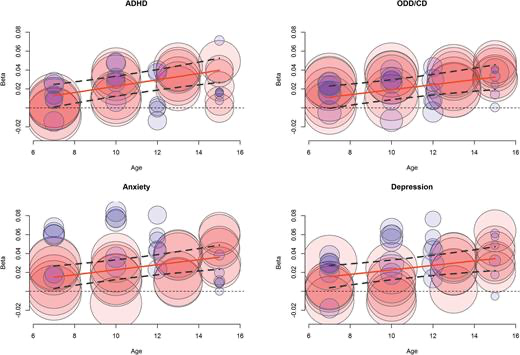
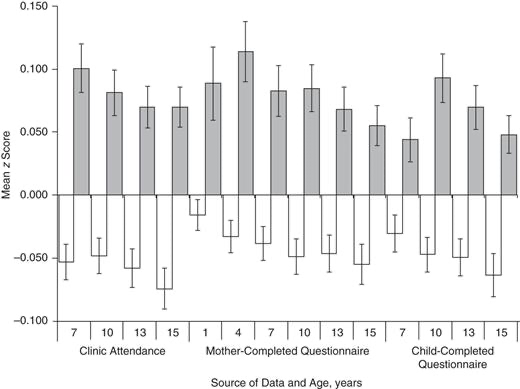
“true” ADHD -> detection in school/home -> GP -> referral -> (mis)diagnosis
“Alcohol use disorder”-> questionnaire -> standard cuttoffs -> AUD phenotype
These chains are biased wrt sex, age, ses, ethnicity..
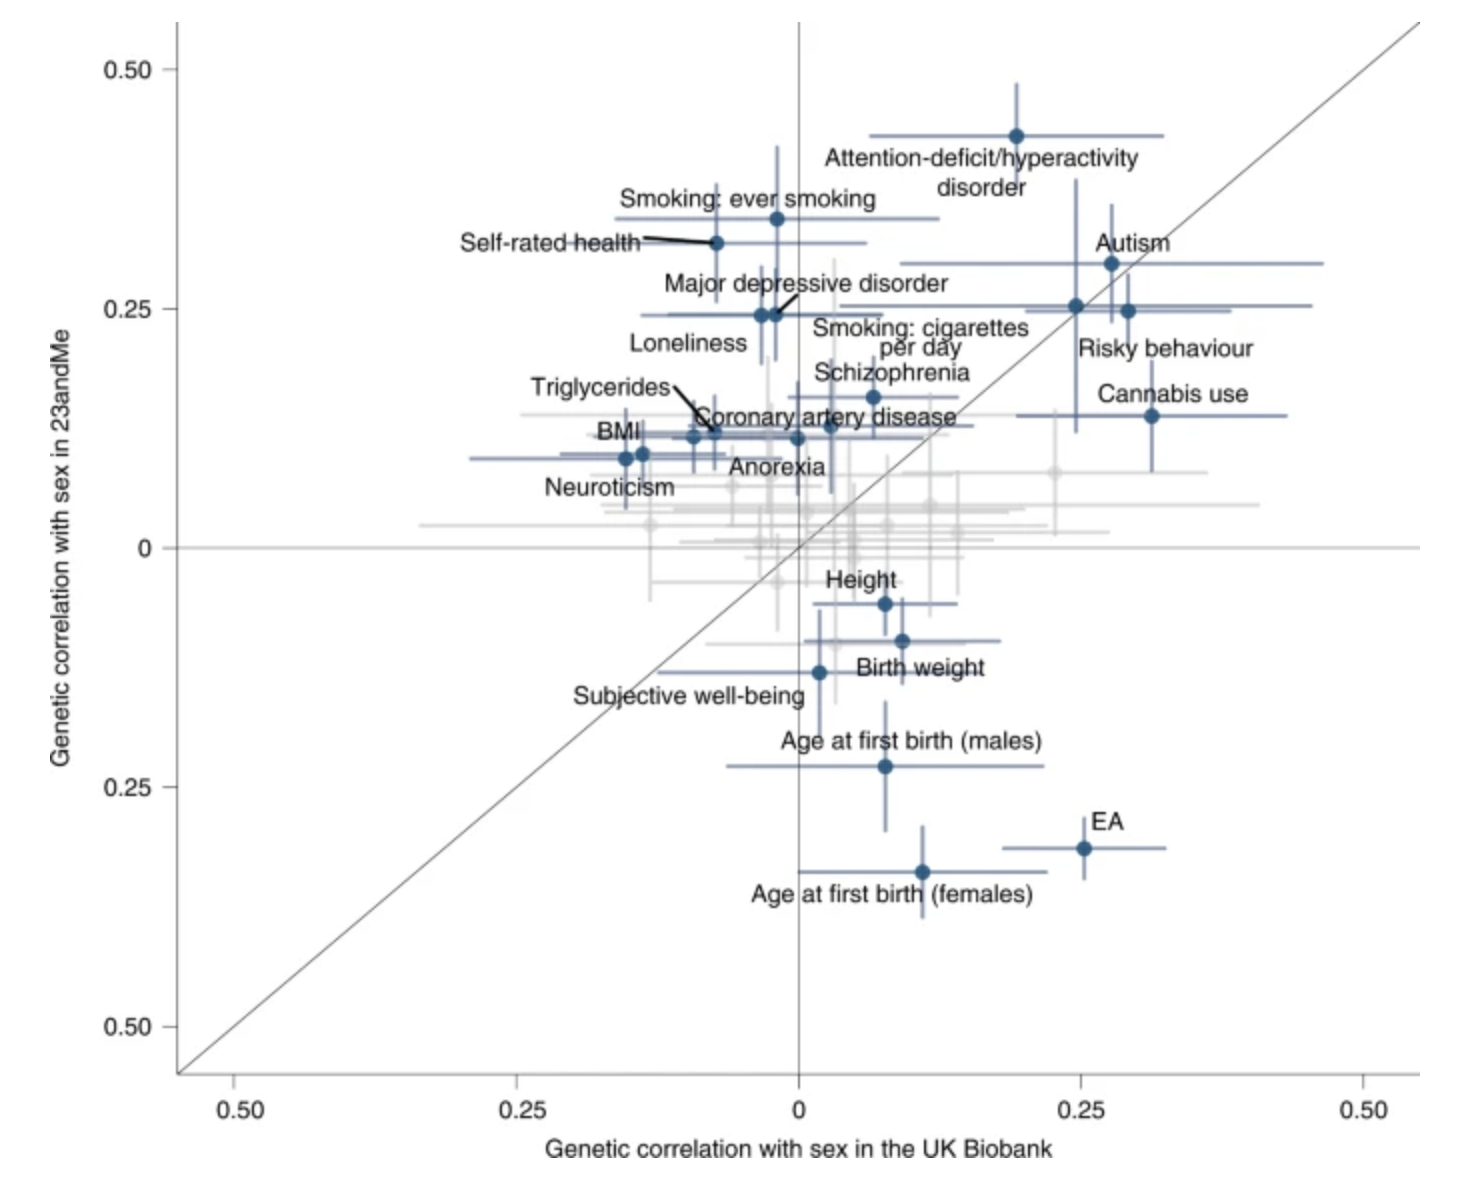
Measurement: Does it matter?
Example Martin et al. rg MDD & BIP in female: 0.55, in male: 0.05
Example AUD, the AUDIT (scale) measures quantity and consequences, do you combine? How do you treat former drinkers?
Measurement: Solution?
Be internally (when designing study) that you are studying the end of a long social process
Be externally clear (in writing) that you are studying the end of a very long causal chain.
Conclussion
Correct inference requires a good statistical genetics model
Correct inference also requires a adequate sampling model
Correct inference also requires a adequate measurement model